Software Tools for Sensitivity and Uncertainty Analysis
Software Tools for Sensitivity and Uncertainty Analysis. H. Scott Matthews 12-706/73-359 Lecture 11 - Oct. 6, 2004. Admin Issues. Reminder: Discounting/Finance Review on Friday - HERE 10:30am HW 2 back on Monday Project feedback coming. Final Notes on Uncertainty.

Software Tools for Sensitivity and Uncertainty Analysis
E N D
Presentation Transcript
Software Tools for Sensitivityand Uncertainty Analysis H. Scott Matthews 12-706/73-359 Lecture 11 - Oct. 6, 2004
Admin Issues • Reminder: Discounting/Finance Review on Friday - HERE 10:30am • HW 2 back on Monday • Project feedback coming
Final Notes on Uncertainty • It is inherent to everything we do • Our goal then is to best understand and model its existence, make better results • We ‘internalize’ the uncertainty by making ranges or distributions of variables • We see the effects by performing sensitivity analysis (one of three methods)
From Last Time: Error bar result Easier to see ‘best case/base case/worst case’ results - imagine moving a straight edge vertically up and down the axis to see result.
Reconsider Photo Sensor Example • (Still using Sens Anal XLS file on web) • Looked last time at ‘Photo’ worksheet • As we add scenarios, the model/spreadsheet becomes increasingly complicated • Adding new columns for different inputs • However, still a straightforward method • We can easily replicate numbers from lecture in this excel file
Adding scenarios/sensitivity • “What if” we care about how the total costs of the base case vary as the price of electricity changes? • “What if” we care about how the percent time natural light is available (i.e. percent time sensors on/off) affects cost of PS? • Can do this quickly and easily with tools • Use ‘Sensit’ excel add-in from last time • http://www.treeplan.com/ • Download .xla (add-in), .xls (example), .pdf (guide)
Sensit Add-in Installation Tips • See course web page for download link • Choose Install option 3 in PDF - “put in Excel Startup folder” • Click “I agree” when sensit dialog comes up on startup • See ‘sens analysis’ spreadsheet from last class for example outputs
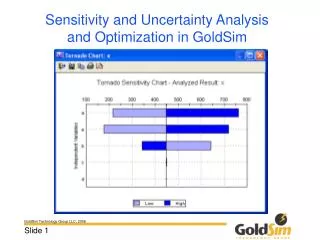
Types of Results in Sensit • Plot : partial sensitivity analysis with one variable • Spider: aggregate result of several partial analyses run separately - all displayed on same figure • Tornado: aggregate result of several partial analyses run separately - all displayed on same figure • Usage: set up spreadsheet framework and formulas, choose “Tools -> Sensitivity Analysis”menu items above
Sensitivity Analysis Plots • Useful for single, what-if questions • Typically “partial” - effect of change in output from 1 input • Calculates/graphs results • We see same ‘results’ as before, but can use a simpler excel model (less columns) • Compare “Photo” worksheet vs. “Photo-Sens Anal” worksheet
Spider/Tornado Diagrams • Show changes in output from all selected inputs by percentage, unit changes, etc • Does sensitivity analysis ‘over a range’ for each input you specify • Shows ‘output at each point in the range’ • Creates useful visualization • Aids in identifying ‘key parameters’ • Just need to be careful in selecting equivalent input ranges so comparison is fair
Notes on Photo Sensor Case • Not so analytically interesting because all inputs have positive contribution to cost • i.e. linear model is X + Y +Z, not X -Y +Z • See sample file that comes with add-in • Simple sales/production cost model • Spider and tornado diagrams more useful
Monte Carlo Sens. Anal. • Monte Carlo analysis’ 3 steps • First, specify probability distributions • Second, trial by random draws (plug them in) • Third, repeat for many (000s) of trials • Produces some distribution of results • Doing Monte Carlo doesn’t “give you the answer”! • Law of large numbers says convergence • See Appendix 7A for spreadsheet tutorial
Monte Carlo Simulations • Download RiskSim add-in from website • See special warnings/notes in BOLD!! • If Excel error msg, choose “no” on update links • May need admin privileges to install • Adds special probability functions to excel • Excel has some, but these are better • Also adds monte carlo math to excel • Distributions: Binomial, Cumulative, Discrete, Exponential, Integer, Normal, Poisson, Triangular, Uniform • Can do almost anything with these as base
Using Monte Carlo Methods • Instead of our ‘point estimates’ from last time, we consider probabilistic functions • Photo-RiskSim worksheet as starting point • Bulb and elec. cost obvious to do with prob. functions • Other variables are constant (e.g., number of bulbs) • Assume bulb cost is triangular, 3.5, 6, 10 • Elec cost normal with mean 0.05, stdev .005 • Now what kind of result will we get? • Use with “Tools-> Risk Simulation” (one output) • Note demo version limited to 300 Monte Carlo trials • Again, photo sensor case not ideal for this - look at production cost example
Wrap-Up • Look at effect of number of trials (50 - 300) • RiskSim Summary worksheet shows 300 trials - note if you do it again, results would be different! • Could do all of this with excel, would just be harder (as usual) • Add-ins like this (or CrystalBall, @RISK) simplify this kind of analysis - you should definitely use these instead. • We have much better models - and knowledge of our results now