Uncertainty and sensitivity analysis
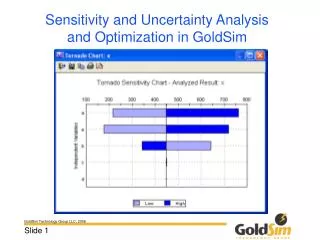
Uncertainty and sensitivity analysis. Marian Scott and Ron Smith Dept of Statistics, University of Glasgow, CEH, Edinburgh Glasgow, Sept 2007. Outline of presentation. Uncertainty (in variables, models, parameters, data) what are uncertainty and sensitivity analyses? an example.

Uncertainty and sensitivity analysis
E N D
Presentation Transcript
Uncertainty and sensitivity analysis Marian Scott and Ron Smith Dept of Statistics, University of Glasgow, CEH, Edinburgh Glasgow, Sept 2007
Outline of presentation • Uncertainty (in variables, models, parameters, data) • what are uncertainty and sensitivity analyses? • an example.
Uncertainty of a measurement • All measurement is subject to uncertainty • Analytical uncertainty reflects that every time a measurement is made (under identical conditions), the result is different. • Sampling uncertainty represents the ‘natural’ variation in the organism within the environment.
Evaluation of accuracy • In a laboratory inter-comparison, known-concentration material is used to define the ‘true’ concentration • The figure shows a measure of accuracy for individual laboratories Accuracy is linked to Bias
Evaluation of precision of a measurement • The error is a single value, which represents the difference between the measured value and the true value • The uncertainty is a range of values, and describes the errors which might have been observed were the measurement repeated under IDENTICAL conditions • Error (and uncertainty) includes a combination of variance and bias)
Lack of observations contribute to uncertainties in input data uncertainty in model parameter values Conflicting evidence contributes to uncertainty about model form uncertainty about validity of assumptions Effect of uncertainties
Modelling tools - SA/UA Sensitivity analysis determining the amount and kind of change produced in the model predictions by a change in a model parameter Uncertainty analysis an assessment/quantification of the uncertainties associated with the parameters, the data and the model structure.
Modellers conduct SA to determine (a)if a model resembles the system or processes under study, (b) the factors that mostly contribute to the output variability, (c)the model parameters (or parts of the model itself) that are insignificant, (d)if there is some region in the space of input factors for which the model variation is maximum, and (e) if and which (group of) factors interact with each other.
Design of the SA experiment • Simple factorial designs (one at a time) • Factorial designs (including potential interaction terms) • Fractional factorial designs • Important difference: design in the context of computer code experiments – random variation due to variation in experimental units does not exist.
SA techniques • Screening techniques • O(ne) A(t) T(ime), factorial, fractional factorial designs used to isolate a set of important factors • Local/differential analysis • Sampling-based (Monte Carlo) methods • Variance based methods • variance decomposition of output to compute sensitivity indices
Screening • screening experiments can be used to identify the parameter subset that controls most of the output variability with low computational effort.
Screening methods • Vary one factor at a time (NOT particularly recommended) • Morris OAT design (global) • Estimate the main effect of a factor by computing a number r of local measures at different points x1,…,xr in the input space and then average them. • Order the input factors
Local SA • Local SA concentrates on the local impact of the factors on the model. Local SA is usually carried out by computing partial derivatives of the output functions with respect to the input variables. • The input parameters are varied in a small interval around a nominal value. The interval is usually the same for all of the variables and is not related to the degree of knowledge of the variables.
Global SA • Global SA apportions the output uncertainty to the uncertainty in the input factors, covering their entire range space. • A global method evaluates the effect of xj while all other xi,ij are varied as well.
Choice of sampling method • S(imple) or Stratified R(andom) S(ampling) • Each input factor sampled independently many times from marginal distbns to create the set of input values (or randomly sampled from joint distbn.) • Expensive (relatively) in computational effort if model has many input factors, may not give good coverage of the entire range space • L(atin) H(ypercube) S(sampling) • The range of each input factor is categorised into N equal probability intervals, one observation of each input factor made in each interval.
SA -analysis • At the end of the computer experiment, data is of the form (yij, x1i,x2i,….,xni), where x1,..,xn are the realisations of the input factors. • Analysis includes regression analysis (on raw and ranked values), standard hypothesis tests of distribution (mean and variance) for subsamples corresponding to given percentiles of x, and Analysis of Variance.
Some ‘newer’ methods of analysis • Measures of importance VarXi(E(Y|Xj =xj))/Var(Y) HIM(Xj) =yiyi’/N Sobol sensitivity indices • Fourier Amplitude Sensitivity Test (FAST)
How can SA/UA help? SA/UA have a role to play in all modelling stages: • We learn about model behaviour and ‘robustness’ to change; • We can generate an envelope of ‘outcomes’ and see whether the observations fall within the envelope; • We can ‘tune’ the model and identify reasons/causes for differences between model and observations
On the other hand - Uncertainty analysis • Parameter uncertainty • usually quantified in form of a distribution. • Model structural uncertainty • more than one model may be fit, expressed as a prior on model structure. • Scenario uncertainty • uncertainty on future conditions.
Tools for handling uncertainty • Parameter uncertainty • Probability distributions and Sensitivity analysis • Structural uncertainty • Bayesian framework • one possibility to define a discrete set of models, other possibility to use a Gaussian process • model averaging
An uncertainty example (1) Wet deposition is rainfall ion concentration Rainfall is measured at approximately 4000 locations, map produced by UK Met Office. Rain ion concentrations are measured weekly (now fortnightly or monthly) at around 32 locations.
An uncertainty example (2) BUT • almost all measurements are at low altitudes • much of Britain is upland AND measurement campaigns show • rain increases with altitude • rain ion concentrations increase with altitude Seeder rain, falling through feeder rain on hills, scavenges cloud droplets with high pollutant concentrations.
An uncertainty example (3) Solutions: • More measurements X at high altitude are not routine and are complicated (b) Derive relationship with altitude X rain shadow and wind drift (over about 10km down wind) confound any direct altitude relationships (c) Derive relationship from rainfall map model rainfall in 2 separate components
An uncertainty example (5) Wet deposition is modelled by r actual rainfall s rainfall on ‘low’ ground (r = s on ‘low’ ground, and (r-s) is excess rainfall caused by the hill) c rain ion concentration as measured on ‘low’ ground f enhancement factor (ratio of rain ion concentration in excess rainfall to rain ion concentration in ‘low’ground rainfall) deposition = s.c + (r-s).c.f
An uncertainty example (6) Rainfall Concentration Deposition
An uncertainty example (7) a) modelled rainfall to 5km squares provided by UKMO - unknown uncertainty scale issue - rainfall a point measurement measurement issue - rain gauges difficult to use at high altitude optimistic 30% pessimistic 50% how is the uncertainty represented? (not e.g. 30% everywhere)
An uncertainty example (8) b) some sort of smoothed surface (change in prevalence of westerly winds means it alters between years) c) kriged interpolation of annual rainfall weighted mean concentrations (variogram not well specified) assume 90% of observations within ±10% of correct value d) campaign measurements indicate values between 1.5 and 3.5
An uncertainty example (9) Output measures in the sensitivity analysis are the average flux (kg S ha-1 y-1) for (a) GB, and (b) 3 sample areas
An uncertainty example (10) Morris indices are one way of determining which effects are more important than others, so reducing further work. but different parameters are important in different areas
An uncertainty example (11) • 100 simulations Latin Hypercube Sampling of 3 uncertainty factors: • enhancement ratio • % error in rainfall map • % error in concentration
An uncertainty example (12) Note skewed distributions for GB and for the 3 selected areas
An uncertainty example (13) Mean of 100 simulations Standard deviation Original
An uncertainty example (14) CV from 100 simulations Possible bias from 100 simulations
An uncertainty example (15) • model sensitivity analysis identifies weak areas • lack of knowledge of accuracy of inputs a significant problem • there may be biases in the model output which, although probably small in this case, may be important for critical loads
Conclusions • The world is rich and varied in its complexity • Modelling is an uncertain activity • SA/UA are an important tools in model assessment • The setting of the problem in a unified Bayesian framework allows all the sources of uncertainty to be quantified, so a fuller assessment to be performed.
Challenges Some challenges: • different terminologies in different subject areas. • need more sophisticated tools to deal with multivariate nature of problem. • challenges in describing the distribution of input parameters. • challenges in dealing with the Bayesian formulation of structural uncertainty for complex models. • Computational challenges in simulations for large and complex computer models with many factors.