Download
1 / 16

E N D
Ten years of OMI measurementsat Finnish Meteorological InstituteJohanna Tamminen, AnttiArola, SeppoHassinen, SimoTukiainen, JanneHakkarainen, JariHovila, NiiloKalakoski, Marko Laine, AnuMäättä, JukkaKujanpää, ViktoriaSofieva, IolandaIalongo, OsmoAulamo, TimoPirttijärvi, TimoRyyppö, RigelKivi, Anders Lindfors, TeroMielonenWith special thanks to Gilbert Leppelemeir and AnssiMälkkiFinnish Meteorological Institute OMI Science TeamMeeting De Bilt, the Netherlands, March 11-13, 2014
OMI - a success story in Finland • First remote sensing instrument where Finland had a significant role in building the instrument: • Technology project • OMI heritage and experience has been usedin VTT’s new developments in hyperspectral imagers for UAVs and nano-satellites. • For Partria experience and reference from OMI opened doors for developing similar Detector Electronic Units for ESA missions. • For Space Systems Finland OMI built experience on developing reliable ground processing systems applicable also in other fields.
OMI - a success story in Finland (cont.) • Satellite Operations: • Beginning of satellite data reception activities in Finland • Sodankylä Very Fast Delivery service • First operational satellite product : Surface UV radiation, important for health, ecosystems, climate and air quality • Science Project: UV radiation in Antarctic, Nov 9-10
OMI total ozone – monthly mean in Arctic February March April Figure I. Ialongo, FMI
OMI and TOMS ozone and UV time series data used to study the link between the total ozone in spring and summer UV in Northern Hemisphere high and mid-latitudes • Inter-annual variability in springtime ozone abundance explains up to 20–40% of the summer UV variability • Arctic ozone depletion 2011 increased the March–August cumulative erythemal clear-sky UV dose in the Northern Hemisphere extratropics by 3–4% compared to the climatology Correlation functions between the TOMS/OMI March extratropical (north of 35°N) total ozone and monthly mean total ozone and noontime UVI in polar latitudes (north of 60°N) and mid-latitudes (35–60°N) from March to December. (Absolute values shown for red lines.) Reference: Karpechko, A. Yu., et al. (2013), The link between springtime total ozone and summer UV radiation in Northern Hemisphere extratropics, J. Geophys. Res. Atmos., 118, 8649–8661, doi:10.1002/jgrd.50601.
Aura Direct Broadcast data reception in Sodankylä • High-latitude site optimal for data reception of Polar satellites • Coverage: most of Europe Distribution in the web Direct Broadcast receiver Observations
omivfd.fmi.fi OMI real time products • Daily measurements of • Ozone • UV-radiation • SO2 • Aerosols • Available within 15-20 min after satellite overpass. • Coverage: Northern Europe
Grimsvötnvolcanic eruption May 21st 2011 May 23. May 22. • Fast availability of data important for forecasts to support aviation • OMI VFD used to follow the transport of the ash and to constrain the dispersion forecasts. • The eruption was strongest on 22 May and on 25th it arrived to Southern Finland • Increased PM10 values clear on May 25th • Concentration of smaller particles not increased May 24. May 25. OMI ash (AAI) during four days Particulate matter in Helsinki May 22-28, 2011
Sulfur dioxide from metal smelters in Siberia Averaged SO2: Jun-Aug, 2005-07 OMI SO2 on May 14th, 2012 June 2013 – Smoke plume from Colorado The smoke plume originating from the wildfires in Colorado reached Europe in 25th June 2013
Sodankylä satellite validation site at high latitudes: International SAUNA-1 and SAUNA-2 campaigns • Improve consistency of various instruments and algorithms: • Ozone measurements during high column • Challenging conditions: low sun periods • SAUNA 1: March-April 2006 • SAUNA 2: February-April 2007 • Ground based instruments: ozone LIDAR, 6 Brewers, 2 Dobsons, 4 DOAS, 96 ozonesondes, dual sondes, CFH
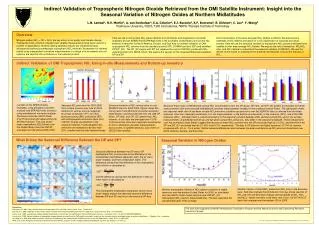
Global NO2 as seen by OMI Figure from TEMIS service (www.temis.nl)
Detection of emission hotspot in Northern Europe Pori port and city center OMI NO2 (summer 2005 - 2011) Figure I. Ialongo, FMI
Detection of emission hotspot in Northern Europe Work ongoing to validate OMI NO2 at high latitudes Pori port and city center Overlap with STEAM ship emissions OMI NO2 (summer 2005 - 2011) Figure I. Ialongo, FMI
OMI UV data used for estimating seasonal variation of spatial distribution of new particle formation • One of the key questions in climate research is the role of aerosols • Nucleation mode aerosols are below the detection limit of satellites • Proxies used instead Proxy P2, assuming SO2 constant, for CN (3-25 nm) NH Winter Spring Autumn Summer Reference: Kulmala, M., Arola, A., Nieminen, T., Riuttanen, L., Sogacheva, L., de Leeuw, G., Kerminen, V.-M., and Lehtinen, K. E. J.: The firstestimates of globalnucleationmodeaerosolconcentrationsbased on satellitemeasurements, ACP., 11,, 2011.
From OMI VFD to Polar Satellite data center • Extended real-time satellite data services under development • New 7.3 m antenna • ESA Security and safety standards • Highspeed 10 Gbit /s network • NASA/NOAA SuomiNPP data reception (OMPS, VIIRS) • Sentinel collaborative ground segment OMPS Total ozone
OMI - Happy 10 years anniversary! Thank you Colleagues: The success is based onexceptionally good collaboration between the Netherlands, USA and Finland. Grimsvötneruption 2011 Figue: NASA