Lesson 2
Lesson 2. Aligning sequences and searching databases. Homology and sequence alignment. Homology. Homology = Similarity between objects due to a common ancestry. Hund = Dog, Schwein = Pig. Sequence homology. Similarity between sequences as a result of common ancestry.

Lesson 2
E N D
Presentation Transcript
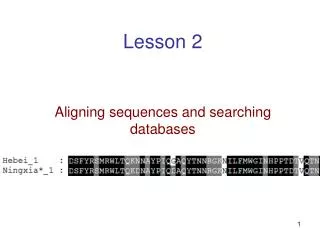
Lesson 2 Aligning sequences and searching databases
Homology Homology = Similarity between objects due to a common ancestry Hund = Dog, Schwein = Pig
Sequence homology Similarity between sequences as a result of common ancestry. VLSPAVKWAKVGAHAAGHG ||| || |||| | |||| VLSEAVLWAKVEADVAGHG
Sequence alignment Alignment:Comparing two (pairwise) or more (multiple) sequences. Searching for a series of identical or similar characters in the sequences.
Why align? VLSPAVKWAKV ||| || |||| VLSEAVLWAKV • To detect if two sequence are homologous. If so, homology may indicate similarity in function (and structure). • Required for evolutionary studies (e.g., tree reconstruction). • To detect conservation (e.g., a tyrosine that is evolutionary conserved is more likely to be a phosphorylation site.
Sequence alignment If two sequences share a common ancestor – for example human and dog hemoglobin, we can represent their evolutionary relationship using a tree VLSPAV-WAKV ||| || |||| VLSEAVLWAKV VLSEAVLWAKV VLSPAV-WAKV
Perfect match A perfect match suggests that no change has occurred from the common ancestor (although this is not always the case). VLSPAV-WAKV ||| || |||| VLSEAVLWAKV VLSEAVLWAKV VLSPAV-WAKV
A substitution A substitution suggests that at least one change has occurred since the common ancestor (although we cannot say in which lineage it has occurred). VLSPAV-WAKV ||| || |||| VLSEAVLWAKV VLSEAVLWAKV VLSPAV-WAKV
Indel Option 1: The ancestor had L and it was lost here. In such a case, the event was a deletion. VLSEAVLWAKV VLSPAV-WAKV ||| || |||| VLSEAVLWAKV VLSEAVLWAKV VLSPAV-WAKV
Indel Option 2: The ancestor was shorter and the L was inserted here. In such a case, the event was an insertion. L VLSEAVWAKV VLSPAV-WAKV ||| || |||| VLSEAVLWAKV VLSEAVLWAKV VLSPAV-WAKV
Indel Normally, given two sequences we cannot tell whether it was an insertion or a deletion, so we term the event as an indel. Deletion? Insertion? VLSEAVLWAKV VLSPAV-WAKV
Indels in protein coding genes Indels in protein coding genes are often of 3bp, 6bp, 9bp, etc... Gene Search In fact, searching for indels of length 3K (K=1,2,3,…) can help algorithms that search a genome for open reading frames (ORFs).
Global vs. Local Global alignment– finds the best alignment across the entire two sequences. Local alignment– finds regions of similarity in parts of the sequences. Global alignment: forces alignment in regions which differ ADLGAVFALCDRYFQ |||| |||| | ADLGRTQN-CDRYYQ Local alignment will return only regions of good alignment ADLG CDRYFQ |||| |||| | ADLG CDRYYQ
Global alignment PTK2 protein tyrosine kinase 2 of human and rhesus monkey
Proteins are comprised of domains Human PTK2 : Domain A Domain B Protein tyrosine kinase domain
Protein tyrosine kinase domain In leukocytes, a different gene for tyrosine kinase is expressed. Domain A Domain X Protein tyrosine kinase domain
The sequence similarity is restricted to a single domain PTK2 Domain A Protein tyrosine kinase domain Domain B Domain X Protein tyrosine kinase domain Leukocyte TK
Conclusions Use global alignment when the two sequences share the same overall sequence arrangement. Use local alignment to detect regions of similarity.
Pairwise alignment AAGCTGAATTCGAA AGGCTCATTTCTGA One possible alignment: AAGCTGAATT-C-GAA AGGCT-CATTTCTGA-
AAGCTGAATT-C-GAA AGGCT-CATTTCTGA- This alignment includes: 2mismatches 4 indels (gap) 10 perfect matches
Choosing an alignment for a pair of sequences Many different alignments are possible for 2 sequences: AAGCTGAATTCGAA AGGCTCATTTCTGA A-AGCTGAATTC--GAA AG-GCTCA-TTTCTGA- AAGCTGAATT-C-GAA AGGCT-CATTTCTGA- Which alignment is better?
Scoring system (naïve) Perfect match: +1 Mismatch: -2 Indel (gap): -1 AAGCTGAATT-C-GAA AGGCT-CATTTCTGA- A-AGCTGAATTC--GAA AG-GCTCA-TTTCTGA- Score: =(+1)x10 + (-2)x2 + (-1)x4= 2 Score: =(+1)x9 + (-2)x2 + (-1)x6 = -1 Higher score Better alignment
Alignment scoring - scoring of sequence similarity: • Assumes independence between positions: • each position is considered separately • Scores each position: • Positive if identical (match) • Negative if different (mismatch or gap) • Total score = sum of position scores • Can be positive or negative
Scoring system • In the example above, the choice of +1 for match,-2 for mismatch, and -1 for gap is quite arbitrary • Different scoring systems different alignments • We want a good scoring system…
Scoring matrix • Representing the scoring system as a table or matrix n X n (n is the number of letters the alphabet contains. n=4 for nucleotides, n=20 for amino acids) • symmetric
DNA scoring matrices Uniform substitutions between all nucleotides: Match Mismatch
DNA scoring matrices Can take into account biological phenomena such as: Transition-transversion
Amino-acid scoring matrices Take into account physico-chemical properties
Scoring gaps (I) In advanced algorithms, two gaps of one amino-acid are given a different score than one gap of two amino acids. This is solved by giving a penalty to each gap that is opened. Gap extension penalty < Gap opening penalty
Scoring gaps (II) The dependency between the penalty and the length of the gap need not to be linear.
Amino-acid substitution matrices Actual substitutions: Based on empirical data Commonly used by many bioinformatics programs PAM & BLOSUM
Protein matrices – actual substitutions The idea: Given an alignment of a large number of closely related sequences we can score the relation between amino acids based on how frequently they substitute each other M G Y D E M G Y D E M G Y E E M G Y D E M G Y Q E M G Y D E M G Y E E M G Y E E In the fourth column E and D are found in 7 / 8
PAM Matrix - Point Accepted Mutations • The Dayhoff PAM matrix is based on a database of 1,572 changes in 71 groups of closely related proteins (85% identity => Alignment was easy and reliable). • Counted the number of the substitutions per amino-acid pair (20 x 20) • Found that common substitutions occurred between chemically similar amino acids
PAM Matrices Family of matrices PAM 80, PAM 120, PAM 250 The number on the PAM matrix represents evolutionary distance Larger numbers are for larger distances
Example: PAM 250 Similar amino acids have greater score
PAM - limitations Based only on a single, and limited dataset Examines proteins with few differences (85% identity) Based mainly on small globular proteins so the matrix is biased
BLOSUM Henikoff and Henikoff (1992) derived a set of matrices based on a much larger dataset BLOSUM observes significantly more replacements than PAM, even for infrequent pairs
BLOSUM:BlocksSubstitutionMatrix Based on BLOCKS database ~2000 blocks from 500 families of related proteins Families of proteins with identical function Blocks are short conserved patterns of 3-60 aa without gaps AABCDA----BBCDA DABCDA----BBCBB BBBCDA-AA-BCCAA AAACDA-A--CBCDB CCBADA---DBBDCC AAACAA----BBCCC
BLOSUM Each block represents a sequence alignment with different identity percentage For each block the amino-acid substitution rates were calculated to create the BLOSUM matrix
BLOSUM Matrices BLOSUMn is based on sequences that share at least n percent identity BLOSUM62 represents closer sequences than BLOSUM45
Example : Blosum62 Derived from blocks where the sequences share at least 62% identity
PAM vs. BLOSUM PAM100 = BLOSUM90 PAM120 = BLOSUM80 PAM160 = BLOSUM60 PAM200 = BLOSUM52 PAM250 = BLOSUM45 More distant sequences