Download
1 / 34
340 likes | 497 Vues
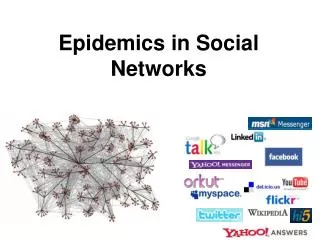
Contagious Diseases in Social Networks. Epidemiology Models. SIS Model. A healthy vertex because infected at a rate proportional to An infected vertex becomes healthy at rate 1 Question: What does this process do on different types of graphs? Does it exist forever? Does it die out?

E N D
SIS Model • A healthy vertex because infected at a rate proportional to • An infected vertex becomes healthy at rate 1 • Question: What does this process do on different types of graphs? • Does it exist forever? Does it die out? • How does the starting point affect the virus?
Epidemic Thresholds for Bdd Degree • thresholds. • If , it can survive from any point • If , it can survive, but every vertex heals almost surely • If , the infection almost surely dies. • -dimensional grid - • Trees -
SIS On PA Graphs • Main change – we now have a power law degree distribution • Epidemic – an infection lasts in a network for a super-polynomial amount of time.
Influence of Patient Zero • If initial degree is , processes survives with high probability for an exponential length of time. • Else: probably dies Why?
Distributing Vaccines • Previous work shows that high degree nodes keep the infection going. • How should you modify the structure of the network to prevent epidemics? • We have C amount of vaccine to distribute
Distributing Vaccines • Uniformly distribute the vaccines • Just up the infection rate • Use contact tracing • Consider a star graph – C needs to be • Distribute according to degree • Requires and infection time is at most
The Christakis-Fowler Study • We know diseases spread via social contact • What about other ‘epidemics’? • What influence does your social network have on your health and specifically obesity? • Also studied the spread of divorce, emotions, ‘the widow effect’…
Why distinguish the sources? • Analysis: predicting the dynamics of the system. Whether a new norm of behavior, technology, or idea can diffuse like an epidemic. • Design: for designing a system to induce a particular behavior, e.g.: • vaccination strategies (random, targeting a demographic group, random acquaintances, etc.) • viral marketing campaigns
The Framingham Heart Study • 3 generations inducted in 1948, 1971 and 2002 • Members medically examined every 3 years • 5,124 egos in middle generation • Examinations included recorded family, friend and neighbor ties • Average 7.5 links, 45% had a friend link.
Obesity Clusters • Observed clusters of obese people (>30BMI) • Is it due to: • Homophily: you friend people who look like you • Induction/Influence: your obese friend changes your opinions about body image • Environment: Due to unobserved variables, like gym access, other societal influence
Experimental Challenge • We only have observational data, not control. • What tests can we do to separate the three hypotheses? • http://christakis.med.harvard.edu/av/video/obesity.mov
Logistic Regression • Used to predict a categorical outcome • Assume • Given observed data find to minimize
Shalizi-Thomas Argument • With only observational data, you can not distinguish between homophily and contagion • If Joey jumps off a bridge, why does that make his friend Irene more likely to do so to?
Causation Explanations • Influence or social contagion: Because they are friends, Joey inspires Irene to jump. More subtly: seeing Joey jump recalibrates Irene's tolerance for risk, making jumping seem like a better idea. • Biological contagion: Joey is infected with a parasite which suppresses the fear of heights and, because they are friends, Joey passes it on to Irene. • Manifest homophily: Joey and Irene are friends because they both like to jump off bridges (hopefully with bungee cords attached). • Latent homophily: Joey and Irene are friends because they are both hopeless adrenaline junkies, and met through a roller-coaster club; their common addiction leads both of them to take up bridge-jumping. • External causation: Sometimes, jumping off a bridge is the only sane thing to do
The Back-Door Path • X(i) – Type of person variables • Y(i,t) – Has taken the action at time t • A(i,j) – the social network • If Joey and Irene are friends, that tells us something about what kind of person Irene is, X(i), and so about whether Irene will jump off a bridge today. And this is so whether or not there is any direct influence of Joey's behavior on Irene's, whether or not there is contagion.
Statistical Tests • Is it ever possible for us to rule out homophily or influence as a hypothesis? • Build generative models so that we can develop tests that work on them! • Model a flickr dataset of users tagging photos
Generative Models • Given G and a set of active users at each time: • Homophily – draw , draw • Correlation – draw , draw activation times from • Influence – Draw , at each time each non-active node because active with probability • Time of activation is what matters
The Shuffle Test • Fit a statistical model with original data • Permute the ordering of • Fit the same model • If the parameters haven’t changed much, time of activation wasn’t important • Theorem: The shuffle test rules out influence in the correlation model
Model Assumptions • Influence model: each agent becomes active in each time step independently with probability p(a), where a is the # of active friends. • Natural choice for p(a): logistic regression function: with ln(a+1) as the explanatory variable. I.e., • Coefficient measures social correlation.
Fitting the Model • We compute the maximum likelihood estimate for parameters and . • Let Ya = # pairs (user u, time t) where u is not active and has a active friends at the beginning of time step t, and becomes active in this step. • Let Na= …… does not become active in this step. • Find to maximize • For convenience, we cap a at a value R.
Edge Reversal Test • Used by Christakis-Fowler • Fit the model • Reverse the direction of the edges • Fit a new modelNo theorems, needs to be empirically evaluated
Results on Flickr Dataset • No discernible influence • Can detect some influence in the spread of misspellings
Critiques • Graph is fixed • Still isn’t as good as a controlled experiment