Download
1 / 36
360 likes | 396 Vues
Learn inventory management decisions, types of inventory, reporting methods, costing techniques, and market valuation rules for finance optimization. Understand inventory transactions with real-world examples.

E N D
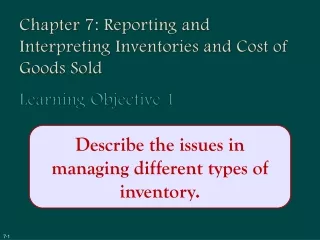
Chapter 7: Reporting and Interpreting Inventories and Cost of Goods SoldLearning Objective 1 Describe the issues in managing different types of inventory. 7-1
Inventory Management Decisions The primary goals of inventory managers are to: 1. Maintain a sufficient quantity to meet customers’ needs 2. Ensure quality meets customers’ expectations and company standards 3. Minimize the costs of acquiring and carrying the inventory 7-2
Types of Inventory Merchandisers . . . • Buy finished goods. • Sell finished goods. Manufacturers . . . • Buy raw materials. • Produce and sell finished goods. Merchandise inventory Raw Materials Work in Process Finished goods Completed products awaiting sale Materials waiting tobe processed Partially complete products 7-3
Learning Objective 2 Explain how to report inventory and cost of goods sold. 7-4
Cost of Goods Sold Equation BI + P – CGS = EI American Eagle Outfitters’ beginning inventory was $4,800. During the period, the company purchased inventory for $10,200. The cost of goods sold for the period is $9,000. Compute the ending inventory. 7-6
Cost of Goods Sold Equation BeginningInventory$4,800 Purchases$10,000 + Goods Availablefor Sale$15,000 StillHere Sold EndingInventory$6,000 Cost ofGoods Sold$9,000 (Balance Sheet) (Income Statement) 7-7
Learning Objective 3 Compute costs using four inventory costing methods. 7-8
Inventory Costing Methods Specificidentification First-in, first-out(FIFO) Last-in, first-out(LIFO) Weighted average 7-9
Inventory Costing Methods Consider the following information May 6$95 cost May 5$75 cost May 3$70 cost Specific Identification This method individually identifies and records the cost of each item sold as part of cost of goods sold. If the items sold were identified as the ones that cost $70 and $95, the total cost of those items ($70 + 95 = $165) would be reported as Cost of Goods Sold. The cost of the remaining item ($75) would be reported as Inventory on the balance sheet at the end of the period. 7-10
Inventory Costing Methods FIFO LIFO Weighted average May 6$95 cost May 6$95 cost May 6$95 cost May 5$75 cost $80per unit $2403 = May 5$75 cost May 5$75 cost May 3$70 cost May 3$70 cost May 3$70 cost Sold Still there Sold Still there Sold Still there 7-11
Inventory Costing Methods Summary Let’s consider a more complex example. 7-12
Inventory Cost Flow Computations (10 units @ $10) + (5 units @ $8) (10 units @ $7) + (25 units @ $8) 7-13
Inventory Cost Flow Computations (10 units @ $7) + (5 units @ $8) (10 units @ $10) + (25 units @ $8) 7-14
Inventory Cost Flow Computations Weighted Average WeightedAverage Cost = Cost of goods Available for SaleNumber of Units Available for Sale WeightedAverage Cost $41050 units = = $8.20 per unit 7-15
Inventory Cost Flow Computations 15 units @ $8.20 35 units @ $8.20 7-16
Smoothes out price changes. Ending inventory approximates current replacement cost. Better matches current costs in cost of goods sold with revenues. Financial Statement Effects Advantages of Methods Weighted Average First-In, First-Out Last-In, First-Out 7-19
Learning Objective 4 Report inventory at thelower of cost or market. 7-21
Lower of Cost or Market • The value of inventory can fall below its recorded cost for two reasons: • it’s easily replaced by identical goods at a lower cost, or • it’s become outdated or damaged. When the value of inventory falls below its recorded cost, the amount recorded for inventory is written down to its lower market value. This is known as the lower of cost or market (LCM) rule. 7-22
Lower of Cost or Market 1,000 items @ $165 400 items @ $20 Analyze 1 1,000 items @ $150 Record 2 7-23
Learning Objective 5 Analyze and record inventory purchases, transportation, returns and allowances, and discounts. 7-24
Recording Inventory Transactions We will now look at the accounting for purchases, transportation costs, purchase returns and allowances, and purchase discounts. We will record all inventory-related transactions in the Inventory account. 7-25
Inventory Purchases American Eagle Outfitters purchases$10,500 of vintage jeans on credit. Analyze 1 Record 2 7-26
Transportation Cost American Eagle pays $400 cash to a trucker whodelivers the $10,500 of vintage jeans to one of its stores. Analyze 1 Record 2 7-27
Purchase Returns and Allowances American Eagle returned some of the vintage jeans to thesupplier and received a $500 reduction in the balance owed. Analyze 1 Record 2 7-28
Purchase Discounts American Eagle’s vintage jeans purchase for $10,500 had terms of 2/10, n/30. Recall that American Eagle returned inventory costing $500 and received a $500 reduction in its Accounts Payable. American Eagle paid within the discount period. Analyze 1 Record 2 7-29
Learning Objective 6 Evaluate inventory management by computing and interpreting the inventory turnover ratio. 7-31
Supplement 7B The Effects of Errors in Ending Inventory
The Effects of Errors in Ending Inventory Errors in EndingInventory will affectthe Balance Sheet andthe Income Statement. Cost of Goods Sold Equation BI + P – CGS = EI Assume that Ending Inventory was overstated in 2009 by$10,000 due to an error that was not discovered until 2010. 7-35
The Effects of Errors in Ending Inventory Now let’s examine the effects of the2009 Ending Inventory Error on 2010. Assume that Ending Inventory was overstated in 2009 by$10,000 due to an error that was not discovered until 2010. 7-36