Download
1 / 16
180 likes | 434 Vues
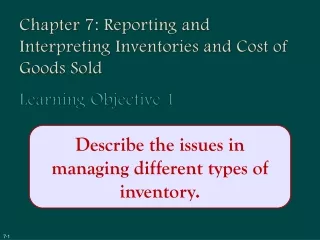
Reporting and Interpreting Cost of Goods Sold and Inventory. Chapter 7. Merchandiser. Merchandise Purchases. Merchandise Inventory. Cost of Goods Sold. Manufacturer. Raw Materials. Raw Materials Inventory. Work in Process Inventory. Finished Goods Inventory. Direct Labor.

E N D
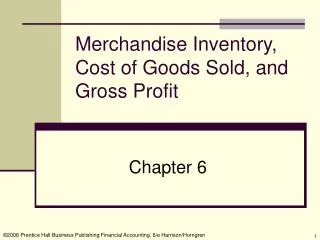
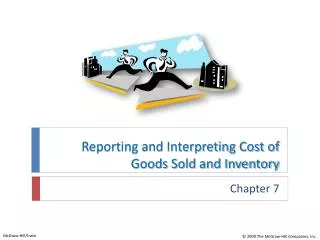
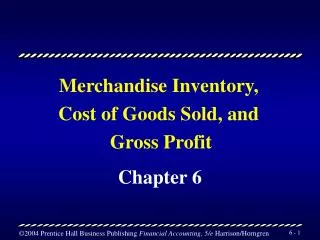
Reporting and Interpreting Cost of Goods Sold and Inventory Chapter 7
Merchandiser MerchandisePurchases MerchandiseInventory Cost ofGoods Sold Manufacturer RawMaterials Raw MaterialsInventory Work in ProcessInventory Finished GoodsInventory DirectLabor Cost ofGoods Sold FactoryOverhead Flow of Inventory Costs
Nature of Cost of Goods Sold BeginningInventory Purchasesfor the Period Goods Availablefor Sale Ending Inventory(Balance Sheet) Cost of Goods Sold(Income Statement) Beginning inventory + Purchases = Goods Available for Sale Goods Available for Sale – Ending inventory = Cost of goods sold
When units are sold, the specific cost of the unit sold is added to cost of goods sold. Specific Identification
First-In, First-Out Method Cost of Goods Sold Oldest Costs Ending Inventory Recent Costs
Last-In, First-Out Method Ending Inventory Oldest Costs Cost of Goods Sold Recent Costs
When a unit is sold, the average cost of each unit in inventory is assigned to cost of goods sold. ÷ Cost of Goods Available for Sale Number of Units Available for Sale Average Cost Method
Smoothes out price changes. Ending inventory approximates current replacement cost. Better matches current costs in cost of goods sold with revenues. Financial Statement Effects of Costing Methods Advantages of Methods First-In, First-Out Last-In, First-Out Weighted Average
Valuation at Lower of Cost or Market Ending inventory is reported at the lower of cost or market (LCM). Replacement CostThe current purchase price for identical goods. The company will recognize a “holding” loss in the current period rather than the period in which the item is sold.This practice is conservative.
Inventory Methods and Financial Statement Analysis U.S. public companies using LIFO also report beginning and ending inventory on a FIFO basis in the financial statement notes if the FIFO values are materially different.
Supplement A: LIFO Liquidations When a LIFO company sells more inventory than it purchases or manufactures, items from beginning inventory become part of cost of goods sold. This is called a LIFO liquidation. When inventory costs are rising, these lower cost items in beginning inventory produce a higher gross profit, higher taxable income, and higher taxes when they are sold.
Supplement B: Additional Issues in Measuring Purchases Purchase returns and allowances are a reduction in the cost of purchases associated with unsatisfactory goods. A purchase discount is a cash discount received for prompt payment of an account.
Supplement B: Additional Issues in Measuring Purchases Credit Period Terms Time Due Discount Period Full amount less discount Full amount due 2/10,n/30 Purchase or Sale Number of Days Discount Is Available CreditPeriod Discount Percent