Download
1 / 87
950 likes | 1.42k Vues
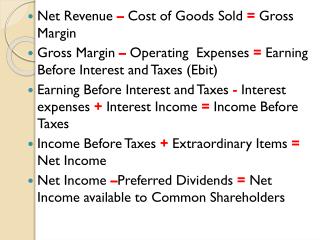
chapter 9. Inventory and Cost of Goods Sold. An electronic presentation by Douglas Cloud Pepperdine University. Learning Objectives. 1. Define inventory for a merchandising business, and identify the different types of inventory for a manufacturing business.

E N D
chapter9 Inventory and Cost of Goods Sold An electronic presentation by Douglas Cloud Pepperdine University
Learning Objectives 1. Define inventory for a merchandising business, and identify the different types of inventory for a manufacturing business. 2. Explain the advantages and disadvantages of both periodic and perpetual inventory systems. 3. Determine when ownership of goods in transit changes hands and what circumstances require shipped inventory to be kept on the books. Continued
Learning Objectives 4. Compute total inventory acquisition cost. 5. Use the four basic inventory valuation methods: specific identification, average cost, FIFO, and LIFO. 6. Explain how LIFO inventory layers are created, and describe the significance of the LIFO reserve. Continued
Learning Objectives 7. Choose an inventory valuation method based on the trade-offs among income tax effects, bookkeeping costs, and the impact on the financial statements. 8. Apply the lower-of-cost-or-market (LCM) rule to reflect declines in the market value of inventory. 9. Use the gross profit method to estimate ending inventory. Continued
Learning Objectives 10. Determine the financial statement impact of inventory recording errors. 11. Analyze inventory using financing ratios, and properly compare ratios of different firms after adjusting for differences in inventory valuation methods. 12. Account for the impact of changing prices on purchase commitments. 13. Record inventory purchase transactions denominated in foreign currencies. EXPANDED MATERIAL
LIFO FIFO LIFO and FIFO in Times of Inflation LIFO assumes the new units are sold Unit Cost of Goods Sold FIFO assumes the old units are sold End of Year Beginning of Year
Time Line of Business Issues Involved With Inventory BUY SELL ADD Raw Materials or Goods for Resale Value Finished Inventory Ending Inventory Cost of Goods Sold COMPUTE
What Is Inventory? Inventory designates goods held for sale in the normal course of business and, in the case of a manufacturer, goods in production or to be placed in production.
How Much Inventory Do Companies Have? Inventory Levels for the 50 Largest Companies, 1979-2000 1998 Inventory as a Percentage of Total Assets 2000 Source: Standard and Poor’s Compustat
Raw Materials Raw Materials are goods acquired for use in the production process. Materials that are necessary in the production process but are not directly incorporated into the product are referred to as indirect materials. Materials that are used directly in the production of goods are frequently referred to as direct materials.
Work in Process Work in process consists of materials partly processed and requiring further work before they can be sold. This inventory includes three cost elements. 1. Direct materials 2. Direct labor 3. Manufacturing overhead
Finished Goods Income Statement Raw Materials Work in Process Finished Goods Cost of Goods Sold Manufacturing Overhead Finished goods are the manufactured products awaiting sale. Balance Sheet Direct Labor
Summary Cost of Goods Sold Sale Manufacturer Raw Materials Work in Process Finished Goods Cost of Goods Sold Overhead Sale Direct Labor Income Statement Items Balance Sheet Items Merchandise Retailer
Periodic Inventory Systems • Cost of Goods Sold is determined and Inventoryis adjusted to proper balance at period end. • All purchases of inventoriable merchandise are recorded in the Purchases account. • Ending inventory is determined by physical count of merchandise on hand.
Perpetual Inventory Systems • Cost of Goods Sold is determined and Inventory is adjusted to proper balance each time inventory is purchased or sold. • All purchases of inventoriable goods are recorded in theInventoryaccount.
Inventory Systems Perpetual Method Inventory 3,000 Accounts Payable 3,000 Purchases of Inventory Periodic Method Purchases 3,000 Accounts Payable 3,000
Inventory Systems Perpetual Method Accounts Receivable 4,125 Sales 4,125 Cost of Goods Sold 2,750 Inventory 2,750 Sales During the Period Periodic Method Accounts Receivable 4,125 Sales 4,125
Whose Inventory Is It? • Goods in Inventory. • Goods in Transit. • FOB Shipping Point: buyer’s inventory from time of shipment. • FOB Destination: seller’s inventory until receipt by buyer. • Goods on Consignment: inventory of the consignor, not the consignee.
QualityProduce Goods in Transit FOB Shipping Point Buyer Seller Goods being shipped are included in inventory of buyer while in transit.
QualityProduce Goods in Transit FOB Destination Buyer Seller Goods being shipped are included in inventory of seller until received by buyer.
Goods on Consignment Title to goods sold on consignment remains with the shipper until their sale or use by the dealer or customer.
What Is Inventory Cost? • Inventory Cost is all expenditures related to inventory acquisition, preparation, and placement for sale. • Trade Discounts • Convert the catalog price to the actual price. • Record inventory at discounted price. • Cash Discounts • Granted for payment of invoices within a limited time period. • Record inventory using the net methodor gross method.
Schedule of Cost of Goods Manufactured Bartlett Corporation Schedule of Cost of Goods Manufactured For the Year Ended December 31, 2005 Bartlett Corporation Schedule of Cost of Goods Manufactured For the Year Ended December 31, 2002 The heading.
Schedule of Cost of Goods Manufactured Bartlett Corporation Schedule of Cost of Goods Manufactured For the Year Ended December 31, 2005 Direct materials: Raw materials $ 21,350 Purchases 107,500 Cost of raw materials available for use $128,850 Less raw materials inventory, Dec. 31 22,350 Raw materials used in production $106,500 Direct labor 96,850 Manufacturing overhead: Continued
Schedule of Cost of Goods Manufactured Manufacturing overhead: Indirect labor $ 40,000 Factory supervision 29,000 Depr.—factory building and equipment 20,000 Light, heat, and power 18,000 Factory supplies 15,000 Miscellaneous manufacturing overhead 12,055 134,055 Total manufacturing costs $337,405 Add work in process inventory, January 1 99,400 $366,805 Less work in process inventory, December 31 26,500 Cost of goods manufactured $340,305
Cash Discounts • Records inventory net of any purchase (cash) discounts. • Example: June 1—purchased merchandise for $10,000 Terms of payment: 2/10, n/30 Assuming a perpetual inventory method, record the purchase of the inventory and payment on June 8.
Cash Discounts 10 Days 20 Days $10,000 Owed $9,800 Owed Supplier “Loan” Period Purchase Date End of Discount Period Final Payment Date
Cash Discounts—Net Method June 1 Inventory 9,800 Accounts Payable 9,800 June 8 Accounts Payable 9,800 Cash 9,800
Cash Discounts—Net Method Now, assume that the payment was not made until June 28.
Cash Discounts—Net Method June 28 Accounts Payable 9,800 Discounts Lost 200 Cash 10,000
Cash Discounts—Net Method If the invoice has not been paid at the end of the period (assume June 30) and the discount period has lapsed, the following adjusting entry is made: June 30 Discounts Lost 200 Accounts Payable 200
Cash Discounts—Gross Method • Record inventory at gross cost; discounts are recorded only if taken. • Example: June 1—purchased inventory for $10,000. Terms of payment: 2/10, n/30 Assuming a perpetual inventory method, record the purchase of the inventory and payment on June 8.
Cash Discounts—Gross Method June 1 Inventory 10,000 Accounts Payable 10,000 June 8 Accounts Payable 10,000 Inventory 200 Cash 9,800
Cash Discounts—Gross Method Again, assume that the payment was not made until June 28.
Cash Discounts—Gross Method June 28 Accounts Payable 10,000 Cash 10,000
Purchases Returns and Allowances Periodic Inventory System Accounts Payable 400 Purchase Returns and Allowances 400 Perpetual Inventory System Accounts Payable 400 Inventory 400
Inventory Valuation Methods FIFO Average Cost LIFO Cost Allocation Methods Specific Identification
Inventory Valuation Methods Assume: Purchases: January 1 200 @ $10 $ 2,000 March 23 300 @ $12 3,600 July 15 500 @ $11 5,500 November 6 100 @ $13 1,300 Total purchases 1,100 $12,400 Sales 700 @ $15
Frequency of Use of Inventory Valuation Methods U. S. Companies 1979 and 2000 Inventory 1979 2000 2000 MethodAll CompaniesAll CompaniesLarge Companies FIFO 75.6% 75.9% 68.6% LIFO 25.8% 15.7% 34.6% Average cost 20.8% 21.4% 32.9% Specific Identification 3.7% 4.5% 3.9% SOURCE: Standard and Poor’s COMPUSTAT
Specific Identification Method • Assigns the actual cost of the asset to Inventoryand Cost of Goods Sold. • Provides a highly objective method of matching costs because cost flow exactly matches physical goods flow. • Is almost impossible to implement cost effectively.
Specific Identification Method Jan. 1 200 units @ $10 per unit Mar. 23 300 units @ $12 per unit 500 units @ $11 per unit July 15 Nov. 6 100 units @ $13 per unit 1,100 units Sold 200 units from the January 1 and 500 from the July 15 purchase.
Specific Identification Method Jan. 1 200 units @ $10 per unit 500 units @ $11 per unit July 15 Sold 700
Specific Identification Method Jan. 1 200 units @ $10 per unit = $2,000 = 5,500 500 units @ $11 per unit July 15 Total cost of goods sold $7,500
Specific Identification Method Mar. 23 300 units @ $12 per unit Nov. 6 100 units @ $13 per unit Ending inventory $4,900 Goods Not Sold = $3,600 = 1,300
Average Cost Method • Assigns the same average cost to each unit sold and each item in inventory. • For periodic inventory, the unit cost is the weighted average for the entire period. • For perpetual inventory, the unit cost is computed as a moving average, which changes with each new purchase of goods.
Average Cost Method = $ 2,000 = 3,600 = 5,500 = 1,300 $12,400 Jan. 1 200 units @ $10 per unit Mar. 23 300 units @ $12 per unit 500 units @ $11 per unit July 15 Nov. 6 100 units @ $13 per unit 1,100 units $12,400 1,100 units = $11.27 per unit (rounded) Cost of goods sold = $11.27 x 700 = $7,890 Ending inventory = $11.27 x 400 = $4,510
First-in, First-out (FIFO) Method • Assigns historical unit cost to Cost ofGoods Sold in the order the costs are incurred. • Provides a close match between physical product flow and product cost flow. • Results in the same inventory valuation and Cost of Goods Sold regardless of whether perpetual or periodic inventory is used.
First-in, First-out (FIFO) Method Sold 200 Jan. 1 200 units @ $10 per unit = $2,000 Mar. 23 300 units @ $12 per unit 500 units @ $11 per unit July 15 Nov. 6 100 units @ $13 per unit
First-in, First-out (FIFO) Method Sold 300 Jan. 1 200 units @ $10 per unit = $2,000 = 3,600 Mar. 23 300 units @ $12 per unit 500 units @ $11 per unit July 15 Nov. 6 100 units @ $13 per unit
First-in, First-out (FIFO) Method Sold 200 Jan. 1 200 units @ $10 per unit = $2,000 = 3,600 Mar. 23 300 units @ $12 per unit = 2,200 500 units @ $11 per unit July 15 Nov. 6 100 units @ $13 per unit Total cost of goods sold $7,800