INDICATOR EV A LUATION
Study of relevance of the soil P-saturation index as an indicator of appropriate fertilization practices in agricultural soils from Walloon Region Renneson M., Vandenberghe C., Marcoen J.M., Bock L., Colinet G. 4 parcels / farm. 6 farms. 1 sample / soil type : Question 1.

INDICATOR EV A LUATION
E N D
Presentation Transcript
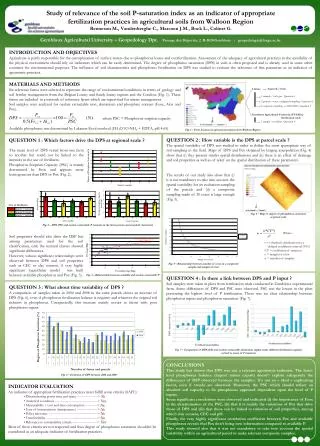
Study of relevance of the soil P-saturation index as an indicator of appropriate fertilization practices in agricultural soils from Walloon RegionRenneson M., Vandenberghe C., Marcoen J.M., Bock L., Colinet G. 4 parcels / farm 6 farms 1 sample / soil type : Question 1 2 parcels → syst. unaligned sampling : Question 2 Composite sampling → 2004-2008 : Question 3 Gembloux Agricultural University (FUSAGx) fertilization trials 1 sample / modality : Question 4 Gembloux Agricultural University – Geopedology Dpt.Passage des Déportés, 2. B-5030 Gembloux - geopedologie@fsagx.ac.be INTRODUCTION AND OBJECTIVES Agriculture is partly responsible for the eutrophication of surface waters due to phosphorus losses and overfertilization. Assessment of the adequacy of agricultural practices to the sensibility of the physical environment should rely on indicators which can be easily determined. The degree of phosphorus saturation (DPS) in soils is often proposed and is already used in some other countries for environmental purposes. The influence of soil characteristics and phosphorus fertilization on DPS was studied to evaluate the relevance of this parameter as an indicator of agronomic practices. MATERIALS AND METHODS Six reference farms were selected to represent the range of environmental conditions in terms of geology and soil fertility management from the Belgian Loamy and Sandy-loamy regions and the Condroz (Fig. 1). These farms are included in a network of reference farms which are supervised for nitrate management. Soil samples were analyzed for oxalate extractable iron, aluminium and phosphate content (Feox, Alox and Pox). Available phosphorus was determined by Lakanen-Erviö method (CH3COO-NH4 + EDTA, pH 4.65). where PSC = Phosphorus sorption capacity Fig. 1 – Farm location in agricultural regions from Walloon Region QUESTION 2 : How variable is the DPS at parcel scale ? The spatial variability of DPS was studied in order to define the most appropriate way of soil sampling in the field. Maps of DPS and Pox obtained by kriging interpolation (Fig. 4) show that (i) they present similar spatial distributions and (ii) there is an effect of drainage and soil properties as well as of relief on the spatial distribution of these parameters. QUESTION 1 : Which factors drive the DPS at regional scale ? The mean level of DPS varied from one farm to another but could not be linked to the intensity in the use of fertilizers. Phosphorus Sorption Capacity (PSC) is mainly determined by Feox and appears more homogeneous than DPS or Pox (Fig. 2). The results of our study also show that (i) it is not mandatory to take into account the spatial variability for an evaluation sampling of the parcels and (ii) a composite sampling made of 20 cores is large enough (Fig. 5). Use of fertilizers Fig. 4 – Map of degree of phosphorus saturation at parcel scale Fig. 2 – DPS, PSC and oxalate extractable P contents in the farms (mean and standard deviation) Where : t = t Student’s distribution for a defined confidence interval (95%) CV = coefficient of variation e = margin of error n = number of samples Soil properties should also drive the DSP but among parameters used for the soil classification, only the textural classes showed significant differences. However, various significant relationshipswere observed between DPS and soil properties such as CEC or clay content. A very highly significant logarithmic modelwas built between available phosphorus and Pox (Fig. 3). *** Fig. 5 – Relationship between number of cores in a composite sample and margin of error Fig. 3 – Relationship between available and oxalate extractable P QUESTION 4 : Is there a link between DPS and P input ? Soil samples were taken in plotsfrom fertilization trials conducted in Gembloux experimental farm. Some differences of DPS and PSC were observed. PSC was the lowestin the plotspresenting the highest level of P fertilization. There was no clear relationship between phosphorus inputs and phosphorus saturation (Fig. 7). QUESTION 3 : What about time variability of DPS ? A comparison of samples taken in 2004 and 2008 in thesame parcels shows an increase of DPS (Fig. 6), even if phosphorusfertilizationbalance is negative and whatever the original soilrichness in phosphorus. Unexpectedly, this increase mainly occurs in farms with poor phosphorus inputs. Fig. 7 – Comparison of DPS (left) and oxalate extractable aluminium (right) under different fertilization regimes related to mean of 0 treatment CONCLUSIONS This study has shown that DPS was not a relevant agronomic indicator. The farm-level phosphorus balance (import minus export) doesn’t explain adequately the differences of DSP observed between the samples. It’s not an « ideal » explicating factor, even if trends are observed. Moreover, the PSC which should reflect an absolute soil capacity to fix phosphorus appeared dependent upon the level of P inputs. Some significant correlations were observed and indicated (i) the importance of Feox in the determination of the PSC, (ii) that it is mainly the variations of Pox that drive those of DPS and (iii) that these can be linked to variation of soil properties, among which clay content, CEC and pH. Finally, the very highly significant correlation coefficient between Pox and available phosphorus reveals that Pox don’t bring new information compared to available P. This study showed also that it was not mandatory to take into account the spatial variability within an agricultural parcel to make relevant composite samples. Fig. 6 – Evolution of DPS between 2004 and 2008 • INDICATOR EVALUATION • An indicator of appropriate fertilization practices must fulfill some criteria (SAFE) : • Discriminating power time and space -------------------> No • Analytical soundness ---------------------------------------> Yes • Measurability / cost and time consumption -----------> No • Ease of interpretation (transparency) -------------------> No • Policy relevance ---------------------------------------------> No • Transferability -----------------------------------------------> No • Relevance to sustainability criteria -----------------------> Yes • Most of these criteria are not respected and thus degree of phosphorus saturation shouldn’t be considered as an adequate indicator of fertilization practices.