Download
1 / 11

E N D
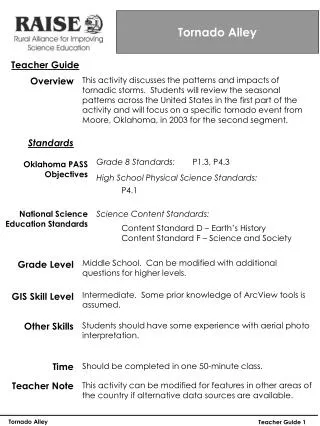
Tornado Alley Teacher Guide This activity discusses the patterns and impacts of tornadic storms. Students will review the seasonal patterns across the United States in the first part of the activity and will focus on a specific tornado event from Moore, Oklahoma, in 2003 for the second segment. Overview Standards P1.3, P4.3 Grade 8 Standards: Oklahoma PASS Objectives High School Physical Science Standards: P4.1 National Science Education Standards Science Content Standards: Content Standard D – Earth’s History Content Standard F – Science and Society Middle School. Can be modified with additional questions for higher levels. Grade Level Intermediate. Some prior knowledge of ArcView tools is assumed. GIS Skill Level Other Skills Students should have some experience with aerial photo interpretation. Time Should be completed in one 50-minute class. Teacher Note This activity can be modified for features in other areas of the country if alternative data sources are available. Tornado Alley Teacher Guide 1
Tornado Alley Teacher Guide Materials This activity relies on several GIS datasets. The files and the designed directories are listed below: C:\ESRI\Projects\Tornado C:\ESRI\ESRIDATA\USA Torn1b.shp 8may2003_fscale.shp Torn5.shp Cities.shp Torn3.shp Torn7.shp 9may2003_fscale.shp okcnty.shp Fujita.avl Winterbuffer.shp Equinbuffer.shp states.shp Roads.avl Tornado.apr Summerbuff.shp C:\ESRI\ESRIDATA\USA\OK C:\ESRI\Projects\2003 Aerials\Oklahoma R2000CLE.shp naip1-1_ok109_2003.sid R2000OKL.shp Sources • KANGIS – kangis.org/community/search/ • GEMS Lesson Plan Search – ‘Blown Away’ by Tom Baker • National Weather Service, Norman, OK – www.srh.hoaa.gov/oun/storms • May 8, 2003: Central Oklahoma Tornadoes – ArcView Shapefiles • Geo Information Systems – www.geo.ou.edu • Oklahoma County - Roads Tiger 2000 (R2000.shp) • Cleveland County – Roads Tiger 2000 (R2000.shp) • Oklahoma Center for Geospatial Information - www2.ocgi.okstate.edu • Oklahoma County 2003 Aerial Photo Lesson Preparation This project utilizes two views in ArcView. The first displays data obtained from the ‘Blown Away’ Lesson from KANGIS. US seasonal tornado patterns are the focus of the first view. The second view contains data related to the May 2003 tornado in Moore, Oklahoma. The view contains local aerial photography as well as storm data from the National Weather Service. Some scale-based view limits can be set on the layers to help speed up the refresh within the project. Developed by Steve O’Connell geographilia@hotmail.com Tornado Alley Teacher Guide 2
Tornado Alley Teacher Guide Overview This activity discusses the patterns and impacts of tornadic storms. Students will review the seasonal patterns across the United States in the first part of the activity and will focus on a specific tornado event from Moore, Oklahoma, in 2003 for the second segment. -- PASS Objectives Middle School. Can be modified with additional questions for higher levels. Grade Level GIS Skill Level Intermediate. Some prior knowledge of ArcView tools is assumed. Time Should be completed in one 45-minute class. Materials: This activity relies on several files in specific directories on the C: drive. Consult the list below: (Note: For ArcView Shapefiles or MrSID files, only the ‘.shp’ or ‘.sid’ file is listed; associated file types (.dbf, .shx,.aux, etc.) are also needed.) C:\ESRI\Projects\Tornado C:\ESRI\ESRIDATA\USA Torn1b.shp 8may2003_fscale.shp Torn5.shp Cities.shp Torn3.shp Torn7.shp 9may2003_fscale.shp okcnty.shp Fujita.avl Winterbuffer.shp Equinbuffer.shp states.shp Roads.avl Tornado.apr Summerbuff.shp C:\ESRI\ESRIDATA\USA\OK C:\ESRI\Projects\2003 Aerials\Oklahoma R2000CLE.shp naip1-1_ok109_2003.sid R2000OKL.shp Sources: KANGIS, National Storm Prediction Center, RAISE Scientist Justin Moss Tornado Alley Teacher Guide
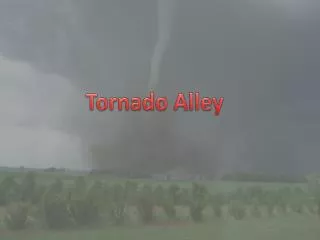
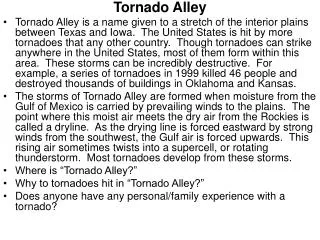
Tornado Alley More tornadoes strike the United States than any other nation on Earth, and in the United States, Tornado Alley is the center of the action. From Texas northward through the Plains of Oklahoma, Kansas, and Nebraska, residents of Tornado Alley are more likely to experience a tornado than people in the rest of the nation. The seasonal pattern of tornadic activity reveals a more diverse distribution of violent weather. The migration of the upper-level jet stream and boundaries between the cold Canadian air and warm Gulf Moisture produce a more varied pattern than many people expect. In this activity you will examine seasonal data for historic tornadoes across the nation. You will compare the concentrations of tornadic weather from one month to another and relate that to the normal weather for that time of year. In addition, you will also look at the effects of one particular tornadic event – Moore and Oklahoma City, Oklahoma, May 8 & 9, 2003. Estimated tornado strengths, damage paths, and aerial images of debris are all part of the analysis. Radar Base Reflectivity image near Tinker AFB from 22:25 UTC, May 8, 2003
Step 1 Getting Started To begin, open ArcView GIS 3.3 by selecting the icon on your desktop. At the Welcome menu, select ‘Open An Existing Project’. Navigate to the following directory: c:\esri\projects\Tornado Open the tornado.apr file. Tornado Alley 2
Step 2 Nationwide Tornado Patterns When your project opens you should see the main project window, displaying a list of two views: Oklahoma May 2003 & US Jet Stream Patterns. Open the US Jet Stream Patterns view. In this view, you will see four themes of Tornado activity – one for January, March, May, and July. Each of these themes contains point data for tornados occurring in the respective month from 1950 to 1990. Turn on the Tornado – January theme. 1. Describe the locations and concentrations of tornadoes during January. In what state do the most intense (F3 or higher) tornadoes occur? MISSISSIPPI 2. Describe the locations and concentrations of tornadoes during May. In what states (name three) do the most intense (F3 or higher) tornadoes occur? ANSWERS INCLUDE: OKLAHOMA, KANSAS, NEBRASKA, IOWA, TEXAS 3. Describe the locations and concentrations of tornadoes during July. In what states (name three) do the most intense (F3 or higher) tornadoes occur? ANSWERS INCLUDE: NORTH DAKOTA, SOUTH DAKOTA, MINNESOTA, NEBRASKA, IOWA Tornado Alley 3
Step 3 Tornadoes and Seasonal Weather Most scientists believe there is a strong correlation between seasons and the development of tornadoes. One of the key components of seasonal change is the location of the upper-level jet stream. The jet stream is a ‘river of air’ located in the atmosphere that helps to move weather systems in a general West to East direction across the United States. As the year moves from winter to summer, the jet stream migrates from south to north, altering the dynamics of weather from coast to coast. In your ArcView activity, there are three jet stream themes, one winter, one summer, and one equinox (for both spring and fall). These graphics show the generalized position of the seasonal jet stream. 4. Do you see a relationship between the location of the Winter Jet Stream and January Tornadoes? YES; THEY ARE BOTH NEAR THE GULF COAST 5. Do you see as strong a relationship between the location of the Equinox Jet Stream and May Tornadoes? NOT AS STRONG 6. What about between the location of the Summer Jet Stream and July Tornadoes? MORE THAN EQUINOX BUT NOT WINTER 7. Which of the three seasonal jet streams shows the strongest relationship to tornado location? WINTER IS STRONGEST 8. Other than the jet stream, what other influences (weather or otherwise) may can cause different patterns of tornadoes? TOPOGRAPHY, TEMPERATURE Tornado Alley 4
Step 4 Oklahoma Tornadoes Now that you have seen some of the general patterns of tornadoes across the United States, we will take a look at a specific event in Oklahoma. In the past several years, the city of Moore, south of Oklahoma City, has been hit by two major tornadoes. The first occurred on May 3, 1999 and was one of the largest and most intense tornadoes in Oklahoma history. The second came as part of a two day outbreak on May 8 and 9, 2003. The path of the 2003 tornado followed almost exactly the path of the 1999 storm. In ArcView, close the US Jet Stream view and open the Oklahoma May 2003 view. The tornadoes we are looking at happened in Oklahoma and Cleveland Counties. Zoom to these counties in your view. When you zoom in, you should see the road layers for each county appear, along with the tracks for the May 8 & 9 tornadoes. We want to focus on the May 8th tornado. Zoom to only the May 8th track. Step 5 The Fujita Scale Tornadoes are classified using a system known as the Fujita Scale. The Fujita scale ranges from 0 to 5 with higher number representing progressively more damaging storm forces. On the last page of this activity, there is a chart displaying information on the different Fujita classifications. Now, we want to reclassify the track to display the different Fujita, or F-values along the damage path. Open the Legend Editor and change the Legend Type to Graduated Color, then select F_scale as the Classification Field. Click Apply. The tornado track should now be several shades of red, with the darkest color representing the highest Fujita value. 9. What is the highest F-value for this tornado track? 4 Tornado Alley 5
Step 5 The Fujita Scale, cont 10. What would be the top wind speed for this tornado? 260 MPH 11. According to the Fujita Scale, what kind of damage would be expected with this type of tornado? DEVESTATING DAMAGE; HOUSES LEVELED/STRUCTURES WITH WEAK FOUNDATIONS BLOWN AWAY SOME DISTANCE/LARGE MISSILES Step 6 GIS Analysis of Tornado Damage Extents GIS can be an important tool for emergency personnel and damage assessment teams who are evaluating the area after a tornado hits. Officials will want to know how big the tornado was, where it first touched down and finally dissipated. In addition, the specific location of damaged or destroyed structures can be determined using aerial photographs. Using your Identify tool and your measure tool, answer the following questions about the tornado damage track. (When looking at the track, answer questions based on the main track, not the small segment to the southwest.) 12. Near what intersection does the May 8th tornado first touch down? S SANTA FE & NW 5TH 13. Near what intersection does the May 8th tornado finally dissapate (use the closest major intersection)? S INDIAN MERIDIAN & E RENO 14. How wide is the widest part of the damage path, in meters? 760M (±25) Tornado Alley 6
Step 7 Air Photo Analysis Your view of the May 8th tornado also includes the color DOQQ for Oklahoma County. This image includes the damage path for this tornado, even though most of the path is in Cleveland County. Turn on the Oklahoma County 2003 DOQQs theme and zoom into the area near the start of the damage path, close to Interstate 35. 15. Can you see the damage path in the photo? What types of structures (residential, commercial, industrial, etc) appear to be the hardest hit? MOSTLY RESIDENTIAL Zoom to the area where the tornado crosses Interstate 40. The tornado at this point had been on the ground for some time and was, at some points, as high as an F4. 16. Are there as many structures damaged here as there were in the area around I-35? What kind of damage is more evident here? NO; MOSTLY VEGETATION/TREES & FIELDS Tornado Alley 7
Table 1 The Fujita Scale Table from The Online Tornado FAQ by Roger Edwards, NOAA/NWS Storm Prediction Center, Norman Oklahoma Tornado Alley 8