Download

1 / 1
10 likes | 122 Vues

E N D
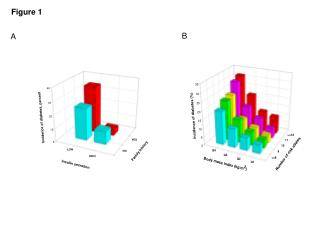
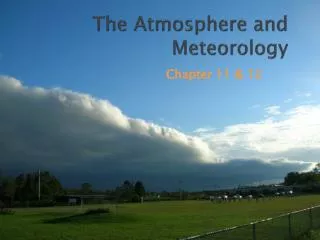
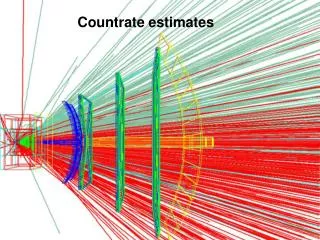
Preliminary validation of computational procedures for a New Atmospheric Ionizing Radiation (AIR) modelJohn M. Clem (1) , Giovanni De Angelis (2,3), Paul Goldhagen (4), John W. Wilson (2)(1) Bartol Research Institute University of Delaware, Newark, DE (2) NASA Langley Research Center, Hampton, VA(3) Istituto Superiore di Sanita’, Rome, Italy(4) Environmental Measurements Laboratory, US Department of Energy, New York, The propagation of primary particles through the Earth's atmosphere has been calculated with a three dimensional Monte Carlo transport program FLUKA [1,2]. Primary protons and alphas are generated within the rigidity range of 0.5GV-20TV uniform in cos2. For a given location, primaries above the effective cutoff rigidity are transported through the atmosphere. Alpha particles are initially transported with a separate package called HEAVY to simulate fragmentation [3]. This package interfaces with FLUKA to provide interaction starting points for each nucleon originating from a helium nucleus. Figure 2: Balloon and Space-Craft observations of primary cosmic rays during different times. Solid lines represent a global fit to all shown data Figure 1: Illustration of particle production in the atmosphere [8] Figure 3: Air density profile used in calculation [4] Figure 5. Sea-level observations of protons and muons [8] compared to this calculation. [1] Fasso, A., A. Ferrari, A. Ranft, P.R. Sala, G.R. Stevenson and J.M.Zazula, `A comparison of FLUKA simulations with measurements of fluence and dose in calorimeter structures', Nuclear Instruments and Methods, A 332, 459, 1993 [2] Clem, J. and L. Dorman, “Neutron Monitor Response Functions,” Space Science Reviews, 93, 335, 2000. [3] Engel, J., T.Gaisser, P. Lipari and T.Stanev,`Nucleus-Nucleus Collisions and Interpretation of Cosmic Ray Cascades',Phys. Rev. D46, 5013, 1992 [4] US Standard Atmosphere, USAF, NOAA, NASA, US Commerce Dept, 1976 [5] Clem, J.M., J.W. Bieber, P. Evenson, D. Hall, J.E. Humble, M. Duldig, `Contribution of Obliquely Incident particles to Neutron Monitor Counting Rate', Journal of Geophysical Research, 102, 26919, 1997 [6] Goldhagen, P., M. Reginatto, T, Kniss, J.W. Wilson, et al., `Measurement of the Energy Spectrum of Cosmic-Ray induced Neutrons aboard an ER-2 High-Altitude Airplane’, Proceedings of the International Workshop on Neutron Field Spectrometry in Science, Technology and Radiation Protection, Pisa, Italy, June 4-8, 2000,Nuclear Instruments and Methods A, in press, 2001. [7] Goldhagen, P., J.M. Clem, J.W. Wilson, R.C. Singleterry, I.W. Jones, M. Reginatto, 'Cosmic-Ray Induced Neutrons: Recent Results from the Atmospheric Ionizing Radiation Measurements Aboard an ER-2 Airplane' this Workshop, 2001. [8] Allkofer, O. and P. Grieder: `Cosmic Rays on Earth', Fachinformationszentrum, Karlsruhe , 1984 Figure 4: ER-2 observations of neutrons in the atmosphere [6,7] compared to this calculation.