Download
1 / 35
350 likes | 591 Vues
The Global Ocean Data Assimilation System (GODAS) at NCEP. D. W. Behringer NOAA / NCEP / EMC NOAA 31st Annual Climate Diagnostics & Prediction Workshop Boulder, CO October 23-27, 2006. Ocean Model MOMv3 quasi-global 1 o x1 o (1/3 o in tropics) 40 levels. Atmospheric Model GFS (2003)

E N D
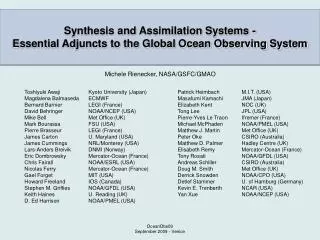
The Global Ocean Data Assimilation System (GODAS) at NCEP D. W. Behringer NOAA / NCEP / EMC NOAA 31st AnnualClimate Diagnostics & Prediction Workshop Boulder, CO October 23-27, 2006
Ocean Model MOMv3 quasi-global 1ox1o (1/3o in tropics) 40 levels Atmospheric Model GFS (2003) T62 64 levels Seasonal to Interannual Prediction at NCEP Climate Forecast System (CFS) Reanalysis-2 3DVAR T62L28 update of the NCEP-NCAR R1 GODAS 3DVAR XBT TAO etc Argo Salinity (syn.) (TOPEX/Jason-1)
Some background: • The operational GODAS • Basic data • Model (MOMv3) • Performance Preparing for the next version of GODAS: • Adding additional data sets to GODAS • TOPEX/Jason-1 altimetry • Argo salinity • Modifying the analysis • A deeper assimilation • A multivariate assimilation Outline of today’s presentation
Basic ocean data used in GODAS • Requirements: • A data set that spans 20+ years. • Global coverage with emphasis on the tropics. • Emphasis on the surface and upper ocean. • Consequently: • Primary reliance on ocean profiles (XBT, TAO, Argo) and on SST (Reynolds analysis). • Stability of TAO and growth of Argo mean in situ profiles retain central importance. • Satellite altimetry, available since 1992, arrived at a time when ocean models were already well constrained by in situ data.
Standard GODAS (MOM V.3) • Operational since September 2003 • Grid: • Quasi-global, 1x1 degree horizontal resolution, enhanced to 1/3 degree in the tropics, 40 vertical levels. • Physics: • KPP boundary layer mixing scheme, GM isopycnal tracer mixing, Smagorinsky velocity mixing, free surface. • Forcing: • Wind stress, heat flux, E-P from Reanalysis 2 (R2), SST relaxed to weekly Reynolds’ analysis, SSS relaxed to Levitus monthly climatology. • Assimilation method: • 3D VAR, univariate in temperature and salinity, error covariance varies geographically and temporally. • Assimilation data: • Temperature profile data from XBTs, profiling floats (Argo), moorings (TAO), synthetic salinity constructed from temperature and local Levitus T-S climatology.
Operational GODAS performance. Standard GODAS does a good job of capturing the El Nino / La Nina signal.
30K/mo Adding TOPEX/Jason-1 to GODAS. A consistent set of altimetry data has been available since late 1992. 12 / 28 / 1997 - 1 / 07 / 1998
Adding TOPEX/Jason-1 to GODAS. Std. w. T/J
Adding TOPEX/Jason to GODAS. G vs TG: RMS COR CON 9.62 0.53 std-G 4.41 0.88 T/J-G 3.11 0.93 A comparison with independent tide gauges outside of the equatorial zone. CON 6.34 0.54 std-G 4.50 0.81 T/J-G 3.25 0.89 CON 4.71 0.81 std-G 3.06 0.92 T/J-G 2.27 0.96
Adding TOPEX/Jason to GODAS. G vs TG: RMS COR CON 5.04 0.84 std-G 5.04 0.83 T/J-G 4.33 0.89 A comparison with independent tide gauges within the equatorial zone. CON 4.97 0.82 std-G 3.73 0.90 T/J-G 3.14 0.93 CON 4.23 0.87 std-G 2.52 0.96 T/J-G 2.03 0.97
Adding Argo salinity to GODAS. Starting in the year 2000 the Argo array has grown to 2573 profiling floats out of a planned 3000.
Deep assimilation. The standard assimilation extends down to 750 m. The deep assimilation extends down to 2200 m.
Deep assimilation. Independent WOCE CTD section completed in 1988 & 1989 … …and repeated in 2003 & 2005 by PMEL. Standard Deep
A multivariate assimilation. Independent TAO ADCP observations. The standard GODAS is univariate in T & S. The modified GODAS is mutivariate in U & V, balancing the T & S corrections through geostrophy. - TAO - TAO
A multivariate assimilation. TAO ADCP Univariate GODAS Mutivariate GODAS - TAO - TAO
Summary Remarks • A consistent, uninterrupted altimetry data set (TOPEX/Jason-1) has been available since late 1992, providing a good basis for testing its impact on GODAS. • In the equatorial Pacific the assimilation of the TAO mooring data leads to a good representation of anomalous SSH in the operational GODAS. The assimilation of T/J-1 improves GODAS SSH beyond the bounds of the TAO array and well into the subtropics. • In the tropical Pacific, a comparison with independent tide gauge data shows that the assimilation of T/J-1 improves the anomalous SSH in GODAS consistently by ~30% outside and 15-20% within the bounds of the TAO array. • In the Atlantic and Indian Oceans the operational GODAS does a relatively poor job representing the SSH anomaly field. In these two oceans the assimilation of T/J1greatly improves GODAS SSH.
Summary Remarks cont’d • The assimilation of the Argo salinity data, which are not part of the operational GODAS data set, produces significant changes in the GODAS salinity field. The changes are entirely consistent with the differences between the observed Argo salinity and the synthetic salinity used in the standard GODAS. • The salinity differences are largest in the surface layers where the notion of a stable T-S relationship, which is the basis of the synthetic salinity, breaks down. • Associated with the changes in salinity are changes in the mean surface currents of the tropical oceans. • In the last few years the Argo array has largely replaced the XBT network as the primary source of global subsurface temperature data. It is also an unprecedented source of subsurface salinity data. There are currently 2573 Argo floats deployed, over 85% of the planned 3000 floats worldwide.
Summary Remarks cont’d • By extending the assimilation from a depth of 750 m in the operational GODAS to a depth of 2200 m, erroneous temperature drifts in the deep (1000-2000m) Indian, Pacific, and Atlantic Oceans. • A comparison of the deep assimilating GODAS with two sections of independent CTD observations, collected at an interval of 25-years along the Atlantic WOCE A16 line, shows that a cold bias of 2-3oC in the standard GODAS has been effectively eliminated. • An unsolved problem in the standard GODAS and in its predecessor Pacific ODAS (RA6) were eastward mean biases in the surface equatorial currents. The standard version of GODAS is univariate in temperature and salinity. A multivariate version of GODAS that applies current corrections in partial geostrophic balance with temperature and salinity corrections appears to provide a promising solution to the problem.
Conclusions • The standard operational GODAS already does a good job even though it only assimilates temperature and salinity. • The success of the standard GODAS in the equatorial Pacific is due to the TAO array. • Although the assimilation of T/J-1 improves the anomalous SSH in GODAS in RMS terms consistently by ~30% outside and 15-20% within the bounds of the TAO array, in absolute terms this is only about 0.5-1.5 cm. • The added value of the Argo array in recent years does not help in the 1980s or 1990s. • The next version of GODAS will nevertheless represent an improved ocean state, but its impact on seasonal-to-interannual forecasting is yet to be determined.
The End cfs.ncep.noaa.gov/cfs/godas www.cpc.ncep.noaa.gov/products/GODAS
SEA ICE for NCEP Climate Forecast System Xingren Wu Jiande Wang Dave Behringer Hua-Lu Pan EMC/NCEP/NOAA
Modeled (left) and observed (right)Arctic sea ice concentration (JFM 1981-2004) Results are from the coupled MOM4 sea ice model using CDAS 2 6-hourly forcing - reasonable sea ice distribution has been simulated. Model Satellite Obs Siberia Greenland Alaska
Evaluation of a simulation of MOM4 coupled to an ice model Jiande Wang Xingren Wu David Behringer NOAA/NCEP/EMC