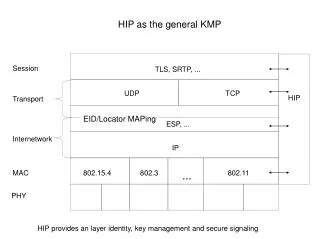
PHY Calibration Results
PHY Calibration Results. Date: 2014-01-20. Authors:. Calibration flowchart from [1] We present results on the noted items for simulation scenario 1. Overview. 5 floor building with 2x10 apartments per floor, 10m x 10m x 3m apartments

PHY Calibration Results
E N D
Presentation Transcript
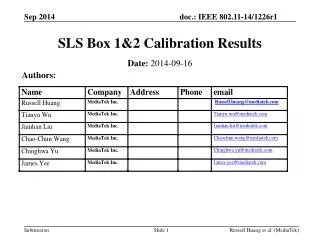
PHY Calibration Results Date: 2014-01-20 Authors: Nihar Jindal, Broadcom
Calibration flowchart from [1] • We present results on the noted items for simulation scenario 1 Overview Nihar Jindal, Broadcom
5 floor building with 2x10 apartments per floor, 10m x 10m x 3m apartments • 1 AP per apartment, either centrally located (give exact coordinates) or randomly located within apartment (uniform distribution) • 11nB model for PL, shadowing, and multipath: • PL: free space (f_c = 2.4e9) until breakpoint distance of 5 meters, exponent of 3.5 after breakpoint distance • Minimum path loss = 30 dB, i.e., PL = minimum of computed PL and 30 dB • Minimum computed before shadowing and wall/floor loss added • Log-normal shadowing with 4 dB std. deviation, iid for every link • Penetration losses: 12 dB floor, 17 dB wall • 2.4 GHz, 20 Mhz channels, either all BSS’s on same channel or each BSS randomly picks 1 of 3 channels • TX power per antenna: 23 dBm AP, 17 dBm STA • 5 dB noise figure -> effective noise floor is -96 dBm • AWGN and 11nB • For 11nB, use Shannon capacity function to compute effective SINR: log2(1+SNR) • For MIMO use MMSE receiver. Specified TX power is per antenna. Scenario 1: Simulation Parameters Nihar Jindal, Broadcom
Place devices, choose random shadowing per link, compute path loss accounting for distance, walls/floors, and shadowing • Turn on specified set of devices and measured SINR’s at appropriate devices • 100% DL: turn on all AP’s and measure SINR at each associated STA • 0% DL: turn on 1 STA (randomly selected within BSS) and measure SINR at each respective AP • 50% DL: in each BSS randomly choose to activate a DL link (to randomly selected STA) or an UL link (from randomly selected STA) and measure SINR at appropriate RX device • # WLAN channels: 1 or 3 (random selection) • Fading: 1x1 AWGN, 1x1 11nB, 2x2 11nB (all rank 2) • Traffic: 100% DL, 0% DL, 50% DL Description of Results Nihar Jindal, Broadcom
Such high SNRs may not be realistic • May want to add intra-apartment walls, or increase intra-apartment shadowing CDF of interference-free SNR Nihar Jindal, Broadcom
SINR CDF for 1 WLAN channel • Left plot: 100% DL or 0% DL traffic • 100% DL and 0% DL have nearly identical SINR’s because UL/DL only differ in transmit power, but that is inconsequential in this scenario because interference-limited • Right plot: 50% DL/UL • UL SINR distribution is 6 dB worse than DL SINR, due to 6 dB lower TX power Nihar Jindal, Broadcom
SINR CDF for 3 WLAN channels • Left plot: 100% DL or 0% DL traffic • 100% DL and 0% DL have nearly identical SINR’s • Right plot: 50% DL/UL • UL SINR distribution is 6 dB worse than DL SINR Nihar Jindal, Broadcom
SINR CDF for 2x2 MIMO • Left plot: 100% DL • Nearly identical to 0% DL SINR’s • Right plot: 50% DL/UL • UL SINR distribution is 6 dB worse than DL SINR • All transmissions are rank 2, MMSE RX Nihar Jindal, Broadcom
Tabulated Results: 1 Channel Nihar Jindal, Broadcom
Tabulated Results: 3 channels Nihar Jindal, Broadcom
Tabulated Results: 2x2 MIMO Nihar Jindal, Broadcom
PHY system simulation results for scenario 1 with previously described parameters, 100% DL, 5 STA’s per BSS • CCA threshold values: -90 dBm, -60 dBm, -30 dBm • Display CDF’s of: • Per-STA throughput • SINR of active links • Per-STA selected MCS • Per-STA airtime PHY System SimCalibration Results Nihar Jindal, Broadcom
Scenario 1, 1x1 11nB Nihar Jindal, Broadcom
Scenario 1, 2x2 11nB Nihar Jindal, Broadcom
Presented SINR calibration results for scenario 1 • Based on an operationally meaningful SINR definition • Included effective SINR results with multipath and 2x2 MIMO • Presented PHY system simulation results for scenario 1 • Allows for calibration of per-STA throughput Summary Nihar Jindal, Broadcom
“HEW Evaluation Methodology”, IEEE 802.11-13/1359r1 References Nihar Jindal, Broadcom