Distribution of Covered Workers by Firm Size and Health Plan Offerings in 2013
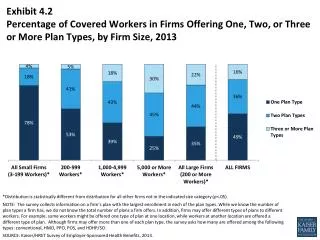
This exhibit analyzes the percentage of covered workers in firms that offer one, two, or three or more types of health plans, categorized by firm size for the year 2013. The data reveals significant statistical differences in distributions among firms of varying sizes (p

Distribution of Covered Workers by Firm Size and Health Plan Offerings in 2013
E N D
Presentation Transcript
Exhibit 4.2Percentage of Covered Workers in Firms Offering One, Two, or Three or More Plan Types, by Firm Size, 2013 *Distribution is statistically different from distribution for all other firms not in the indicated size category (p<.05). NOTE: The survey collects information on a firm’s plan with the largest enrollment in each of the plan types. While we know the number of plan types a firm has, we do not know the total number of plans a firm offers. In addition, firms may offer different types of plans to different workers. For example, some workers might be offered one type of plan at one location, while workers at another location are offered a different type of plan. Although firms may offer more than one of each plan type, the survey asks how many are offered among the following types: conventional, HMO, PPO, POS, and HDHP/SO. SOURCE: Kaiser/HRET Survey of Employer-Sponsored Health Benefits, 2013.