Download
1 / 17
170 likes | 328 Vues
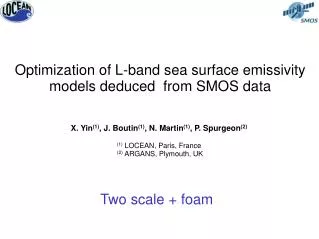
Optimization of L-band sea surface emissivity models deduced from SMOS data. X. Yin (1) , J. Boutin (1) , N. Martin (1) , P. Spurgeon (2) (1) LOCEAN, Paris, France (2) ARGANS, Plymouth, UK. Two scale + foam. Adjustment of some parameters of roughness and foam modeling.

E N D
Optimization of L-band sea surface emissivity models deduced from SMOS data X. Yin(1), J. Boutin(1), N. Martin(1), P. Spurgeon(2) (1) LOCEAN, Paris, France (2) ARGANS, Plymouth, UK Two scale + foam
Adjustment of some parameters of roughness and foam modeling Roughness:Omnidirectional wave spectrum Durden & Vesecki,1985 : a0?Original publication: a0=0.004; DV2, a0=0.008 Th_30° DV2 Nadir • At 15°C, a 0.1K Tb variation can be generated by : • 0.2pss SSS variation • or • - 0.5m/s wind speed variation ~0.2K/m/s Dinnat et al., IJRS, 2002, Radio Science, 2003 10m equivalent neutral wind speed (m/s) Foam coverage (from Monahan & O'Muircheartaigh 1986): b? c? original publication:b=1.95×10⁻⁵, c=2.55 ; ΔT =Tsea-Tair (neglected in this first step study); in first SMOS SSS1 processing, F=0: no foam. Foam emissivity (Stogryn, 1972): assumed to be correct
Modeling of SMOS Tbs • Tb = Tbatm↑ + Rsea (Tbatm↓ + Tbsky) exp(-atm) + Tbsea exp(-atm) Atmosphere Tbsea= (Tbflat+Tbrough) (1-F) + F Tbfoam Tbsea=esea SST Ocean esea derived from SMOS Tbs after correcting for all other effects
Radiometric accuracy SMOS data used in the fit SMOS Tbs: Tbs along track (~ no mixing of polarization) in the AFFOV (good radiometric accuracy) from 19 ascending orbits in August (low galactic noise) in the South Pacific (far from land) from 50°S to 0°N – Incidence angles from 20° to 55° Incidence angle (°) Along track in the AFFOV 5K 5K 0 0
Three different sets of wind induced components deduced from SMOS • There are totally 237501 samples in H polarization and 238469 in V polarization collocated with ECMWF WS in range of 3-17ms-1. • 56% of the ECMWF wind speeds (136861 samples in H polarization and 137471 in V polarization) have been collocated with SSMI WS in range of 3-17 ms-1 : +-0.5h +-50km • 126662 samples in H polarization and 127191 in V polarization, when the differences between ECMWF and SSMI WS were restricted to be less than 2 ms-1
3m/s<U<7m/s a0 (prior=0.004 – 0.008) 8m/s<U<17m/s b, c Data fitting Wind induced component of emissivity deduced (20-55° in step of 5°) Er_SMOS (θi, p, ws)= Eres (θi, p) + Espectrum(a0; θi, p, ws) Incidence angle (°)
M2 M1 ECMWF ECMWF+SSMI M3 SSMI ECMWF
H pol. 20° V pol. 20° H pol. 30° V pol. 30° H pol. 40° Results in AFFOV V pol. 40° H pol. 50° V pol. 50° H pol. 55° V pol. 55° ECMWF WS ECMWF WS
Results in EAFFOV ? H pol. 0° V pol. 0° V pol. 10° V pol. 20°
Monthly averages, Pacific Ocean,August 2010 SSS North-South profile, New parametrization for roughness and foam coverage Old model 1 (DV2) Comparisons w.r.t WOA05
1. The tropical Southern Pacific ocean (20°S10°S- 140°W110°W) far away from continent and island characterized by relative stable moderate wind speed and high SST; mean (standard deviation) of SST and SSS are 24.5 (1.0) °C and 36.2 (0.3) pss 2. The high latitude Southern Pacific ocean (50°S45°S- 180°W100°W) characterized by very variable wind speed and low SST; mean (standard deviation) of SST and SSS are 9,8 (1.8) °C and 34,4 (0.2) pss
SMOS SSS retrieved with the pre-launch model 1 SMOS SSS with the new model M1 in red for the tropical Southern Pacific and in green for the high latitude Southern Pacific
Summary • SMOS data evidence that Tb(U) is non linear • A reasonnable fit to SMOS data is obtained when introducing a foam coverage parametrization close to Monahan and Muircheartaigh (1986), (this foam coverage may be peculiar to L-band and depends on the foam emissivity model) • Parameter for the wave spectrum (a0) slightly higher than 0.004 • Preliminary validation shows improvement in mean retrieved SSS • A larger set of SMOS data should be used for validating and/or improving model • Study the quality of SSS retrieved at high wind speed when putting a larger error on ECMWF wind speed. • Check SMOS measurements taken in the EAFFOV
Latitudinal drift ? EH_SMOS - EH_Model, 0deg EV_SMOS - EV_Model, 0deg
Statistics of SMOS SSS collocated with ARGO at +/-5days and +/-50km during August ascending passes