Download

1 / 15
150 likes | 290 Vues
Impact of sea surface roughness on SMOS measurements A new empirical model. S. Guimbard & SMOS-BEC Team SMOS Barcelona Expert Centre Pg. Marítim de la Barceloneta 37-49, Barcelona SPAIN E-mail: sguimbard@icm.csic.es URL: www.smos-bec.icm.csic.es. Introduction to the fitting process.

E N D
Impact of sea surface roughness on SMOS measurements A new empirical model S. Guimbard & SMOS-BEC Team SMOS Barcelona Expert Centre Pg. Marítim de la Barceloneta 37-49, Barcelona SPAIN E-mail: sguimbard@icm.csic.es URL: www.smos-bec.icm.csic.es
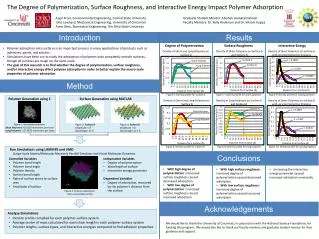
Introduction to the fitting process Sea Surface roughness TB formulation: The estimation of from the data will depend strongly on: • Data quality: instrumental effects (antenna pattern , calibration, drift) & pre-proccessing issues (reconstruction at L1A, sun…) • Gallactic scattered correction term (overestimated) • Type of statistical analysis & auxillary parameters considered
Study angle To construct the new roughness LUT and deal with the exposed previous points, we have proceed as follow: • Very careful data filtering to build our dataset (1. & 3.) • The OTT has been calculated as the mean bias between data and model over the time period of the dataset (2.) • Bin averaging of vs Inc. Angle (θ) & ECMWF Wind Speed (WS) (4.)
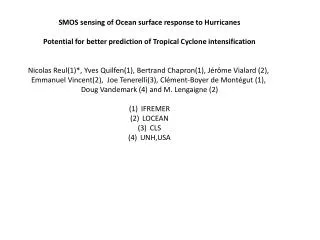
Dataset caracteristics • Level 1 OperationalProcessorversion 3.4 • 31 days of Full-pol data fromAugust 2010 • Onlyascendentorbitshavebeenconsidered • Landcontaminationdetected at Level 1B: wider FOV • OnlypureOceanscenes are kept (lessthan 0.25% of landpixels) • RFI/outliersdetection in the Alias-Free FOV: thresholdontheallowedmaximumdeparturefrommodel (20 K) • Minimization of thegalacticimpact in the Alias-Free FOV : thresholdonthescatteredgalacticmodeledterm (WS =3m/s) (5 K) • Minimization of theFaradayrotationimpact : thresholdon TEC parameter (5 K)
Global Statistics of the data set ~9 millions points Histograms: θ<3° & θ~15° low WS
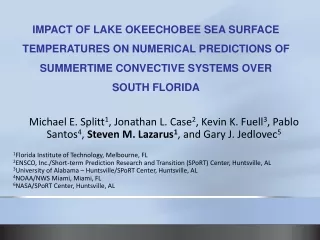
We have considered large bin size: dθ=5° & dWs=2m/s Statistical purpose (Nb of events /bin > 1000) Best trade-off between WS & θ dependencies of TB rough in both polarization (H & V) Drawback: we loose the incidence angle dynamic at high incidence angle in V-pol Inc. angle & wind speed dependency
Auxilary parameters:HS,SST,SSS • WS and Hs are highly correlated • (SST,SSS) and WS are anti-correlated For this data set, bin averaging in dimensional spaces > 2 (Hs,SST,SSS) do not reduce « inbox » dispersion.
FINAL LUT • Cubic interpolation over a 2D grid with θ=1:1:75, WS=0:.25:50 Hs=0:.25:15 & Wind_dir=0:10:360 • No dependancy in Hs and Wind direction • Values of TB rough H & V-pol for θ>60° & WS > 20 m/s remain constant and equal to the value at (θ =60,WS=20)
Conclusions A new Look-Up-Table of the roughness correction term (model 3) has been provide to P. Spurgeon based on this analysis. Time convergence in the salinity retrieval process and quality of the result seem to have been improved. (Convergence is now as fast as models 1 & 2, and retrieved salinity looks close to models 1 & 2). Two points to have in mind: The use of a model dependent OTT introduce a possible “bad” incidence angle dependency. Filtering process => all the data used to build the model are in the South hemisphere oceans. The model is then optimized for this region.
Perspective • Simple analytic formulation of the LUT Tb rough V & H pol terms vs (θ,WS) has been found since the delivery: • can be usefull for extrapolation over the total range of (θ,WS) as it has been defined in the TB rough mod3 • New statistical approach (NN) is in developement to take into account more dependencies (HS,SST,SSS,WS direction) and also to derive a fully empirical model.
Discussion As we seem to have some issues with our imput quality signal at level 2, the inversion approach based on a semi-geophysical model is meaningless. Find the « transfer » function that relie smos measurements with salinity? • We know that this function is non-linear and depend on a huge number of parameters. • We have to deal with Noisy data => Neural network seems to me very well suited to deal with this kind of problem.
Neural Network as a fitting tool This network can be used as a general function approximator. It can approximate any function with a finite number of discontinuities arbitrarily well, given sufficient neurons in the hidden layer.