Download
1 / 12
120 likes | 252 Vues
Architectural-Level Prediction of Interconnect Wirelength and Fanout. Kwangok Jeong, Andrew B. Kahng and Kambiz Samadi UCSD VLSI CAD Laboratory abk@cs.ucsd.edu CSE and ECE Department University of California, San Diego. Done. Ongoing. Motivation.

E N D
Architectural-Level Prediction of Interconnect Wirelength and Fanout Kwangok Jeong, Andrew B. Kahng and Kambiz Samadi UCSD VLSI CAD Laboratory abk@cs.ucsd.edu CSE and ECE Department University of California, San Diego
Done Ongoing Motivation • Early prediction of design characteristics • Interconnect wirelength • Interconnect fanout • Clock frequency • Area, etc. • Enable early-stage design space exploration • Abstractions of physically achievable system implementations • Models to drive efficient system-level optimizations • Existing models fail to capture the impact of (1) architectural and (2) implementation parameters • Significant deviation against layout data
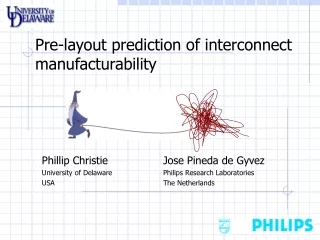
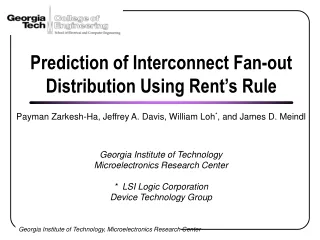
Existing Models • Wirelength statistics • Christie et al. [2000] • Point-to-point wirelength distribution based on Rent’s rule • Extends Davis et al. wirelength distribution model • Significant deviation against layout data • Fanout statistics • Zarkesh-Ha et al. [2000] • Error in counting the number of m-terminal nets per gate • Significant deviation against layout data • Existing models fail to take into account combined impacts of architectural and implementation parameters • Question: What is the impact of considering architectural parameters in early prediction of physical implementation?
Implementation Flow and Tools • Timing-driven synthesis, place and route flow • Consider both architectural and implementation parameters for more complete modeling of design space • Rent parameter extraction through internal RentCon scripts Architectural Parameters Router / DFT RTL (Netmaker / SPIRAL) Synthesis (Design Compiler) Implementation Parameters Wirelength and Fanout Models Place + Route (SOC Encounter) Model Generation (Multiple Adaptive Regression Splines) Wiring Reports
Design of Experiments • Netmaker generation of fully synthesizable router RTL code • SPIRAL generation of fully synthesizable DFT RTL code • Libraries: TSMC (1) 130G, (2) 90G, and (3) 65GP • Tools: Netmaker (University of Cambridge), SPIRAL (CMU), Synopsys Design Compiler and PrimeTime, Cadence SOC Encounter, Salford MARS 3.0 • Experimental axes: • Technology nodes: {130nm, 90nm, 65nm} • Clock frequency • Aspect ratio • Row utilization • Architectural parameters: {fw, nvc, nport, lbuf} for routers and {n, width, t, nfifo} for DFT cores
Modeling Problem → • Accurately predict y given vector of parameters x • Difficulties: (1) which variables x to use, and (2) how different variables combine to generate y • Parametric regression: requires a functional form • Nonparametric regression: learns about the best model from the data itself For our purpose, allows decoupling of underlying architecture / implementation from modeling effort • We use nonparametric regression to model interconnect wirelength (WL) and fanout (FO) → →
Multivariate Adaptive Regression Splines (MARS) • MARS is nonparametric regression technique • MARS builds model of form: • Each basis function Bi(x) takes the following form: • (1) a constant, (2) a hinge function, and (3) a product of two or more hinge functions • There are two steps in the modeling: • (1) forward pass: obtains model with defined maximum number of terms • (2) backward pass: improves generality by avoiding an overfit model ^ → → →
Example Proposed Model Wirelength Model • 2 Models: (1) interconnect wirelength, and (2) interconnect fanout • Closed-form nonlinear equations with respect to architectural and implementation parameters • Suitable to drive early-stage architectural-level design exploration B1 = max(0, nDFT - 16); B2 = max(0, 16 – nDFT); B4 = max(0, 16 - width)×B1; B5 = max(0, util – 0.5); … B35 = max(0,t - 2)×B31; WLavg = 22.487 + 0.056×B1 - 0.328×B2 + … - 0.003×B27 - 0.013×B34 Fanout Model B1 = max(0, nDFT - 16); B2 = max(0, 16 – nDFT); B4 = max(0, nfifo - 2); … B30 = max(0, width - 16)×B9; B33 = max(0, 16 - nDFT)×B18 FOavg = 3.707 + 0.003×B1 - 0.034×B2 - … - 8.567e-6×B30 - 1.225e-5×B33
Impact of Architectural and Implementation Parameters Prop. WL and FO are directly modeled from architectural / implementation parameters Model 1 Rent’s parameters are modeled from architectural / implementation parameters Model 2 Rent’s parameters are modeled from architectural parameters , for impacts from implementation Model 3 Rent’s parameters are extracted from implemented layout
Model Validation Estimated Average Wirelength (um) Estimated Average Fanout Estimated Average Fanout Estimated Average Wirelength (um) Prop. (FO) Prop. (WL) Chr ZH • WL estimation error reductions • DFT: max. error 73% (79.5% 21.3%), avg. error 81% (18.1% 3.1%) • Router: max. error 70% (59.9% 17.9%), avg. error 91% (27.2% 2.3%) • FO estimation error reductions • DFT: max. error 74% (22.7% 5.7%), avg. error 92% (10.1% 0.8%) • Router: max. error 92% (18.2% 1.4%), avg. error 96% (5.6% 0.2%)
Recent Extensions Used described methodology to develop models for (1) chip area and (2) total power Area model Sum of standard cell area + whitespace On average within 5% of the layout data Power model Includes both dynamic and leakage components On average within 6% of the layout data
Conclusions and Future Directions • Proposed a reproducible modeling methodology based on RTL to layout implementation • Developed accurate DFT and router interconnect wirelength (WL) and fanout (FO) models • Improvement over Model 3 • WL: up to 81% (91%) error reduction on average for DFT (router) cores • FO: up to 92% (96%) error reduction on average for DFT (router) cores • Improvement over Model 2 • WL: up to 85% (85%) error reduction on average for DFT (router) cores • FO: up to 89% (96%) error reduction on average for DFT (router) cores • Future Directions: • Model maximum fclk w.r.t. architectural and implementation parameters • Estimators of achievable power/performance/area envelope • Enable efficient system-level design space exploration