Download
1 / 10
100 likes | 240 Vues
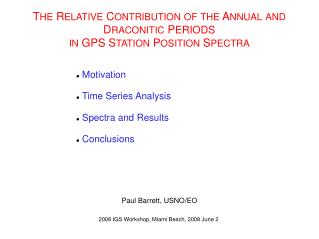
T HE R ELATIVE C ONTRIBUTION OF THE A NNUAL AND D RACONITIC P ERIODS IN GPS S TATION P OSITION S PECTRA. Motivation Time Series Analysis Spectra and Results Conclusions. Paul Barrett, USNO/EO. 2008 IGS Workshop, Miami Beach, 2008 June 2. M OTIVATION. Ray, et al. 2008

E N D
THE RELATIVE CONTRIBUTIONOFTHE ANNUALAND DRACONITIC PERIODSIN GPS STATION POSITION SPECTRA • Motivation • Time Series Analysis • Spectra and Results • Conclusions Paul Barrett, USNO/EO 2008 IGS Workshop, Miami Beach, 2008 June 2
MOTIVATION • Ray, et al. 2008 • Power seen at ~1 cpy and its harmonics (possibly to 8th) • Attributed to draconitic (or GPS precession; 1.04 cpy) period • Not seen in VLBI or SLR data (except annual period) • Results from Fourier Analysis • Power at multiple harmonics gives a ramp function with sharp jump at fundamental period • Implies non-physical signal
DISCRETE FOURIER TRANSFORM (DFT) • Schuster (1905) or Lomb-Scargle (1982) periodogram • Appropriate for small datasets with even samples and gaps, or • Large (>1000 points) datasets with uneven samples and gaps • No off-diagonal terms (i.e. cosine*sine term = 0 ) • Generalized periodogram - Bretthorst (1988) • In “Bayesian Spectrum Analysis and Parameter Estimation” • Appropriate for unevenly sampled data with gaps • 2x2 matrix - including off-diagonal terms • Student t-Distribution • Unknown errors • Marginalize (or integrate-out) standard deviation
SINGLE FREQUENCY SUMMED SPECTRA • ITRF 2005 combination data • GPS station position residuals • 169 stations • >400 weekly measurements • Sum of individual station spectra • Results – two sets of periods • Annual period • And 1st & 2nd harmonic • For each coordinate • Draconitic (1.04 cpy) period • At 2nd & 3rd harmonicsfor each coordinate • At 5th harmonic for north coord • No other signals >7 cpy
DUAL FREQUENCY SUMMED SPECTRA • 4x4 matrix w/off-diagonal terms • Identifies two frequencies • 3.05 cpy & 3.18 cpy
DUAL FREQUENCY SUMMED SPECTRA • Identifies one frequency • Peak is along diagonal • ~6.24 cpy
SINGLE FREQUENCY GLOBAL SPECTRUM • All stations combined • Only annual frequency significant
VLBI SPECTRAL ANALYSIS • Each station separately, then summed • Only annual frequency significant • All stations combined • No significant frequencies
SLR SPECTRAL ANALYSIS • Each station separately, then summed • Only annual frequency significant • All stations combined • Annual frequency significant in North position
CONCLUSIONS • Individual GPS station position residual spectra show: • Annual periods at 1, 2, & 3 cpy • Draconitic periods at ~3.12, ~4.16, & ~6.24 cpy • No significant periods >7 cpy • Global GPS station residuals show only annual periods • Draconitic period is coherent on a per station basis, not between stations • Implies incorrect modeling of orbits during eclipse • Individual and Global SLR station residuals show annual periods • Only Individual VLBI station residuals show an annual period