Download
1 / 17
180 likes | 497 Vues
The Demographic Transition 1. Low growth – 3. Moderate growth 2. High growth – 4. Low growth Population pyramids Age distribution Sex ratio Countries in different stages of demographic transition Demographic transition and world population growth.

E N D
The Demographic Transition • 1. Low growth – 3. Moderate growth • 2. High growth – 4. Low growth • Population pyramids • Age distribution • Sex ratio • Countries in different stages of demographic transition • Demographic transition and world population growth Variations in Population GrowthDemographic Transition
World Population & Growth Rates,400,000 BC - AD 2000 • Demographic transition – The changes in natural increase caused by shifts in birth and death rates in a given area of the Earth.
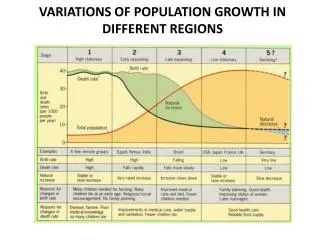
The Demographic Transition Fig. 2-13: The demographic transition consists of four stages, which move from high birth and death rates, to declines first in death rates then in birth rates, and finally to a stage of low birth and death rates. Population growth is most rapid in the second stage.
Demographic Transition Model • 1) Most of our time on Earth • 2) High birth and high death rates • NIR is around 0 with population of world around ½ million • 3) Food is unpredictable • 4) Despite beginning of human settlement, war and disease balance out high birth rates (families depend on children for farming) • Present Day: No countries here • 1) Industrial Revolution in England and North America (1750-1800) • 2) High Birth and decreasing death rates • 3) 10x faster growth • 4) Stabilization of food supply, improvement of sanitation techniques, and creation of wealth through technology and invention • Present day: 1950 – most of Africa, Asia , Lat. Am. Stage 1 Stage 2 • CBR declines to the point where it equal CDR • NIR approaches zero (Zero Population Growth or ZPG) • TFR falls beneath the 2.1 replacement rate • Women enter the workforce, more access to birth control methods, more leisure/entertainment time • Present Day: Much of Europe, Russia as example • 1) CBR drops, but still is higher than CDR; • - CDR continues to decline, but at a slower rate • 2) CBR declines due to changes in customs, people choose to have fewer children because of changes in female roles, jobs in service/urban areas • Present Day: Beginning of 20thcentury Europe and North America, most of Asia and Latin America by end of 20th century Stage 3 Stage 4 • Stage 5? • High CDR and irreversible population decline
Stage 1 • 1) Most of our time on Earth • 2) High birth and high death rates • NIR is around 0 with population of world around ½ million • 3) Food is unpredictable • 4) Despite beginning of human settlement, war and disease balance out high birth rates (families depend on children for farming) • Present Day: No countries here Back
Stage 2 • 1) Industrial Revolution in England and North America (1750-1800) • 2) High Birth and decreasing death rates • 3) 10x faster growth • 4) Stabilization of food supply, improvement of sanitation techniques, and creation of wealth through technology and invention • Present day: 1950 – most of Africa, Asia , Lat. Am. Back
Stage 3 • 1) CBR drops, but still is higher than CDR; • - CDR continues to decline, but at a slower rate • 2) CBR declines due to changes in customs, people choose to have fewer children because of changes in female roles, jobs in service/urban areas • Present Day: Beginning of 20thcentury Europe and North America, most of Asia and Latin America by end of 20th century Back
Stage 4 • CBR declines to the point where it equal CDR • NIR approaches zero (Zero Population Growth or ZPG) • TFR falls beneath the 2.1 replacement rate • Women enter the workforce, more access to birth control methods, more leisure/entertainment time • Present Day: Much of Europe, Russia as example Back
Demographic Transition in England • Low growth until 1750 – bubonic plague causes a decline as does famine, bad harvests • High growth 1750—1880 industrial revolution food supply is more stable, money though industrial employment • Moderate growth 1880-1970s – • Low growth now now has 50 million vs 6 mil in 1st stage Fig. 2-14: England was one of the first countries to experience rapid population growth in the mid-eighteenth century, when it entered stage 2 of the demographic transition.
Basic Patterns of Population Growth • Stage of demo transition gives it a specific shape • Mostly determined by the CBR • Dependency ratio-the number of people who are too young or too old to work compared to the number of people in their productive years – usually divided into 3 groups 0-14, 15-64, 65 older • Stage 2 1 worker for every dependent, stage 4 2 workers for every 1 dependent • Elderly percentage increases as you move through the stages • Stage 4 countries have higher cdrs because population is older
Percent of Population under 15 • 1/3rd of the world population is under 15 • Sex ratio – number of males /100 females; more males than females are born, but men die earlier in Europe/NA 95/100 rest of the world 102/100, in US males under 15 exceed females 105/100 – women start outnumbering men around age 40 by 65 women are 58% • In LDCs high maternal death rates cause the figure to be skewed
Population Pyramids in U.S. cities Fig. 2-16: Population pyramids can vary greatly with different fertility rates (Laredo vs. Honolulu), or among military bases (Unalaska), college towns (Lawrence), and retirement communities (Naples).
Rapid Growth in Cape Verde • 12 small islands off coast of west africa • Colony of portugal until 1975 • Moved from 1-2 in 1950 • Many famines • Pop has tripled, natural increase is 3% Fig. 2-17: Cape Verde, which entered stage 2 of the demographic transition in about 1950, is experiencing rapid population growth. Its population history reflects the impacts of famines and out-migration.
Moderate Growth in Chile • Moved from rural to urban • Many still prefer large families • Was still stage 1 as of 1900 • Most pop increase is from immigration • 1930s move to stage 2 – medical tech; stage 3 since 1960s –vigourous government family planning, high unemployment rates; govt reversed its policy Fig. 2-18: Chile entered stage 2 of the demographic transition in the 1930s, and it entered stage 3 in the 1960s.
Low Growth in Denmark • Stage 4 • Zpg • Increasing # of elderly raises cdr Fig. 2-19: Denmark has been in stage 4 of the demographic transition since the 1970s, with little population growth since then. Its population pyramid shows increasing numbers of elderly and few children.
Census taking in China • Information for pop pyramids is obtained through census taking • Most countries are in 2 and 3 stage – rapid growth/moderate growth • 2 things impacting the model today – tech innovation has diffused throughout the world which drops cdr, cbr continues to increase bc social customs have not changed • 19th c change in cdr due to industiral revolution; drop in cdr in other places due to diffusion of this tech