Changes in Immunoglobulin and Hemoglobin Levels Across Different Study Arms
This study evaluates changes in immunoglobulin levels (IgM and IgA) and CD4/CD8 ratios, alongside hemoglobin levels across three distinct study arms (ARM-A, ARM-B, ARM-C). Mean IgM levels showed significant variation, with a reported normal range of 31-128 mg/dL. IgA levels also reflected variability (normal range: 39-243 mg/dL). The CD4/CD8 ratio, critical for immune response, was assessed (normal range: 1.0-2.0). Hemoglobin levels, representing oxygen-carrying capacity, were compared across groups (normal range: 11-14 g/dL).

Changes in Immunoglobulin and Hemoglobin Levels Across Different Study Arms
E N D
Presentation Transcript
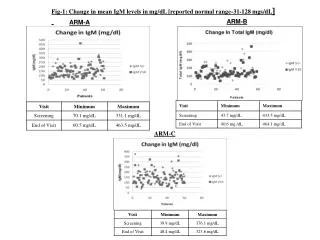
Fig-1: Change in mean IgM levels in mg/dL [reported normal range-31-128 mgs/dL] ARM-B ARM-A ARM-C
Fig-2: Mean change in IgA (mg/dL) [Reported normal range-39-243 mgs/dL] ARM-A ARM-B ARM-C
Fig-3: Change in mean CD4/CD8ratio [Reported normal range-1.0-2.0] ARM-B ARM-A ARM-C
Fig-4: Change in Haemoglobin g/dL [Reported normal range-11-14 gms/dL] ARM-A ARM-B ARM-C