State Board Meeting
220 likes | 239 Vues
Learn about the Maryland School Progress Index, a comprehensive accountability system that evaluates school performance and progress towards college and career readiness. Discover the indicators, targets, and strategies for improving student achievement and reducing achievement gaps. Stay informed with webinars, brochures, and FAQs.

State Board Meeting
E N D
Presentation Transcript
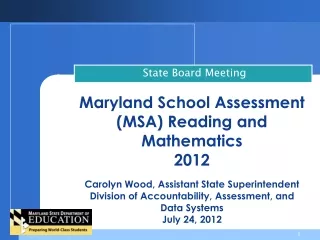
State Board Meeting School Progress Index2012 ResultsMary Gable- Assistant State Superintendent Division of Academic PolicyCarolyn Wood - Assistant State Superintendent Division of Accountability, Assessment and Data SystemsDecember 17, 2012
ESEA FLEXIBILITY • All schools should improve the learning of all students. • Schools have different needs and operate in specific contexts - the strategies they adopt for improvement should reflect their needs. • School performance targets should reflect the school’s history of student performance.
ESEA FLEXIBILITY Communication • Website • Webinars and Presentations • Brochures and Handouts • Videos • Frequently Asked Questions (FAQs) • Facebook and Twitter
What is the School Progress Index? • Continuous scale based on indicators of adequacy: • Achievement (E, M, HS) • Growth (E, M) • Gap Reduction (E, M, HS) • College & Career Readiness (HS) • Stakeholder Input (Standard Setting): • Each indicator is individually weighted based on importance in assessing overall school progress • Measures within indicators individually weighted • Measured at the Elementary, Middle, and High School Levels (span) • Combined schools with multiple span codes are measured at each level and then combined to create a single score
Maryland School Progress Index Revised 12/4/12 Grades PreK-8 Grades 9-12 Meeting Performance Targets (AMO) Meeting Performance Targets (AMO) Achievement* Achievement* 30% 40% • 33.3%-Mathematics Proficiency (Algebra/ • Data Analysis HSA) • 33.3%- English Proficiency (English HSA) • 33.3%- Science Proficiency (Biology HSA) • 33.3%- Mathematics Proficiency (MSA) • 33.3%- Reading Proficiency (MSA) • 33.3%- Science Proficiency (MSA) Gap* Gap* 40% 40% Gap between lowest subgroup and highest subgroup within a school: Gap between lowest subgroup and highest subgroup within a school: • 33.3%- Mathematics Proficiency (MSA) • 33.3%- Reading Proficiency (MSA) • 33.3%- Science Proficiency (MSA) • 20%- Mathematics Proficiency (Algebra/ • Data Analysis HSA) • 20%- English Proficiency (English HSA) • 20%- Science Proficiency (Biology HSA) • 20%- Cohort Graduation Rate • 20%- Cohort Dropout Rate Growth* College-and Career-Readiness* 30% 20% Percent of students making one year’s growth: • 60%- Cohort Graduation rate • 40%- College and Career Preparation (CCP) • Advanced Placement or International Baccalaureate • Career and Technology Education (CTE) Concentrators • Enrollment in College (2-Year, 4-year, and/or Technical School) • 50%- Mathematics Proficiency (MSA) • 50%- Reading Proficiency (MSA) *ALT-MSA is included in the index component
Elementary/Middle/High SchoolIndicator: Achievement • Percentage of “all students” group scoring proficient or advanced on Maryland standardized assessments progressing toward targets • This is about progress, not performance • PreK-8 • MSA Math Proficiency • MSA Reading Proficiency • MSA Science Proficiency • Grades 9-12 • HSA Algebra/Data Analysis Proficiency • HSA English Proficiency • HSA Biology Proficiency
Elementary/Middle/High School Indicator: Gap Reduction • Decrease in the performance gap between the highest and lowest performing subgroups • Gap Score calculated for each subgroup category in each measured area • PreK-8 • MSA Math Proficiency • MSA Reading Proficiency • MSA Science Proficiency • Grades 9-12 • HSA Algebra/Data Analysis Proficiency • HSA English Proficiency • HSA Biology Proficiency • 5-Year Adjusted Cohort Graduation Rate • 4-Year Adjusted Cohort Dropout Rate
Elementary/Middle Indicator: Growth • The change in student performance for the “all students” group between the current year and prior year PreK-8 MSA Math Proficiency MSA Reading Proficiency
High SchoolIndicator: College- and Career-Readiness (CCR) • Met annual targets on measures that assure students are ready for college or career upon graduation • 5-Year Cohort Adjusted Graduation Rate • College and Career Preparation (CCP)- Students who have exited high school with a Maryland State High School Diploma and meet any one of the following: • Advance Placement or International Baccalaureate • Earned a score of 3 or greater on an Advanced Placement (AP) exam • Earned a score of 4 or greater on an International Baccalaureate (IB) exam • Career and Technology Education (CTE) Concentrators • Attained advance standing in a State-approved Career & Technology Education program of study • Enrollment in College • Entered a post-secondary institution (2-yr, 4-yr, or technical school) within 16 months of graduation
State Level Gap Reduction (Inverse) Annual Measureable Objectives (AMOs)
State Level Growth and College- and Career-Readiness Annual Measureable Objectives (AMOs) Growth AMOs College and Career Readiness AMOs (High School) *Based on a 50% reduction in 9 years
State School Progress Index Results for Elementary School Achievement: % of Students who Scored Advanced or Proficient Gap: (inverse of) % Difference Between Highest and Lowest Subgroup Growth: % of Students whose Performance was Equal to or Better than Last Year CCR: % of Students in Cohort who Graduated / had a CCP success *PSV= Progress Scale Value
State School Progress Index Results for Middle School Achievement: % of Students who Scored Advanced or Proficient Gap: (inverse of) % Difference Between Highest and Lowest Subgroup Growth: % of Students whose Performance was Equal to or Better than Last Year CCR: % of Students in Cohort who Graduated / had a CCP success * PSV= Progress Scale Value
State School Progress Index Results for High School Achievement: % of Students who Scored Advanced or Proficient Gap: (inverse of) % Difference Between Highest and Lowest Subgroup Growth: % of Students whose Performance was Equal to or Better than Last Year CCR: % of Students in Cohort who Graduated / had a CCP success * PSV= Progress Scale Value
Overall State School Progress Index The School Progress Index Score for the State is weighted by the percent of students in each span (elementary, middle and high school).
State Board Meeting School Progress Index- Strands for Support, Intervention, and Recognition for Schools and All School Summary
Strand Categorization • Number of Indicators Met includes: • Indicators for which the Percent Proficient of Target for the weighted indicator composite = 1.00 or greater • Indicators that were not evaluated due to small population • E, M, H defines a particular grade span for a school. • E – Elementary • M – Middle • H – High Some schools may have multiple grade spans (i.e. a school containing grades 6-12 would be a MH school).
2012 School Progress Index Strand for Support, Intervention and RecognitionSummary Results
Questions? Carolyn Wood cwood@msde.state.md.us Mary Gable mgable@msde.state.md.us