Laser Beam Coherence Measurement for He-Ne Laser Frequency Separation
90 likes | 219 Vues
This experiment aims to determine the frequency separation between the axial modes of a He-Ne Laser by measuring coherence length. By setting up an experimental apparatus and capturing fringe patterns through photography, the contrast of fringes is analyzed to calculate coherence. Detailed steps for the experimental setup, procedure, and data analysis are provided along with instructions for photographing and analyzing the fringes using ImageJ and Excel.

Laser Beam Coherence Measurement for He-Ne Laser Frequency Separation
E N D
Presentation Transcript
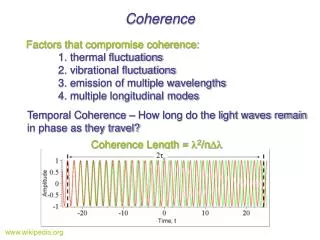
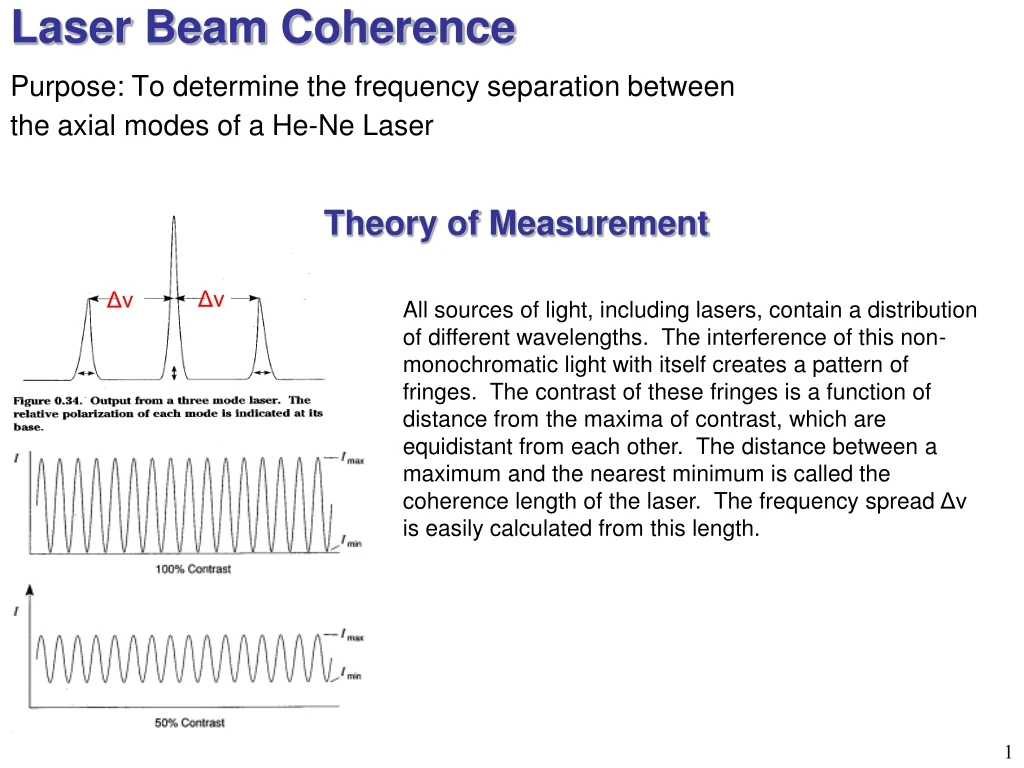
Laser Beam Coherence Purpose: To determine the frequency separation between the axial modes of a He-Ne Laser Theory of Measurement Δν Δν All sources of light, including lasers, contain a distribution of different wavelengths. The interference of this non-monochromatic light with itself creates a pattern of fringes. The contrast of these fringes is a function of distance from the maxima of contrast, which are equidistant from each other. The distance between a maximum and the nearest minimum is called the coherence length of the laser. The frequency spread Δν is easily calculated from this length.
Experimental Setup Setup • Mount laser assembly (LA) to the far side of the optics table (OT). Adjust the position so that the beam is parallel to the edge and along the tapped holes in the OT. • Mount a beam steering assembly (BSA) along the beam path at the next corner of the OT and insert a mirror mount. Adjust the height of the mirror mount until the beam intersects the center of the mirror. Rotate the post until the laser beam is reflected at a 90˚ angle. • Place a second BSA in line with the laser beam at the opposite corner of the OT. Adjust the mirror mount until the laser beam is parallel to the surface of the OT and rotated 90˚. • Insert a short focal length (25.4 mm) negative lens (LP3) into a lens chuck assembly and mount it five inches from the first BSA-I. Align the lens so that the diverging beam is centered on the mirror of the second BSA-I. • Insert a longer focal length (200mm) lens (LP2) into an LCA and place is 225 mm from the first lens in the diverging beam. Again, center the beam on the second mirror. • Rotate the second BSA such that the beam returns back through the two lenses just to either side of the laser output aperture. • Carefully adjust the position of the last lens by moving it back and forth along the beam until the returning beam is the same size as the output beam. • Mount a 50/50 beam splitter into a lens chuck assembly (LCA) and rotate the assembly 45˚ to the optical path. • Mount a BSA with its mirror centered about the path of the reflected beam five inches from the beam splitter. Adjust the mirror until its beam is directed back to the laser. • Mount a BSA on a stepper motor assembly with its mirror centered about the path of the transmitted beam. Adjust the mirror so that the beam is retro-reflected back to the laser. • Mount an index card as an observation screen on the other side of the beam splitter.
Experimental Procedure • Mount a camera as close to the observation screen as possible without obstructing the laser beam. Make sure the camera is as secure as possible. Ideally, the camera lens should be parallel to the observation screen. • Adjust the mirror position (using the stepper motor) so that the path lengths are equal. Note: the light has to pass through the glass to reflect off the beam splitter; this additional path length is approximately times the thickness of the beam splitter. Record this position. • At each position, adjust the fixed mirror so that there are about five fringes. • Take pictures of the fringes with different shutter speeds. Be sure not to move the camera between pictures. • Using the stepper motor, move the mirror away from the beam splitter in 1cm increments. At each point, take another set of pictures with the same camera settings.
Photographing the Fringes • Before photographing the fringes, we determined a range of exposure times we wanted to use and found, by an iterative process, the f-stop (f = 11) that yielded the sharpest images across the range of exposure times. • For each centimeter, a series of five photographs was taken, each with a different shutter speed. The f-stop was held constant at f=11. Bracketing the exposures in such a way increased the dynamic range of the camera’s CCD allowing us to better analyze the contrast of the fringes. • The photographs were straightened and cropped using Photoshop. • After straightening, the images were analyzed using ImageJ. For each image, a rectangular selection was made about the center of the image, as shown, and the profile was plotted (Analyze-> Plot Profile). • From this profile, the list of points was copied into Excel and plotted with the rest of the profiles from the series. The maximum and minimum intensities listed for each series was used to calculated the percent contrast of the fringes.
Data • We exported intensity data from ImageJ to Excel • Using the min and max of the center fringes, we calculated contrast for each plot 1/2500 s 1/2500 s 93% Contrast 1/1000 s 1/1600 s 1/2000 s 1/1200 s Used this range to find min/max 73% Contrast 1/1000 s 1/1600 s 1/1200 s 1/2000 s 1/2500 s 1/2500 s 1/2500 s 0 cm 13 cm
Analysis I • We calculated the contrast for each series of photographs then plotted the results as a function of position • This variation in contrast is due to the coherence of the beam • The distance from max to min in contrast is the coherence length • We fit the plot with a Sin function • From the period of the Sin we extracted the coherence length Coherence Length Max contrast Min contrast
Analysis II • The coherence length gives us the frequency spread of the laser • We can compare this to the dimensions of the laser to see how realistic our results are where L is the length of the laser cavity and ΔL is the coherence length • Doubling the coherence length gives an estimate of the laser cavity length • The difference in estimated cavity lengths is likely due to an under-estimation of the internal components of the laser
Error Discussion • Range of motion • Because of the range of the stepper motor we were unable to fully explore the maxima because they occurred near the ends of its track • Vibrations in the room • Oscillations of the walls cause visible fringe vibrations where time dependence was not expected • Uncertainty in path length • Uncertainty in distance between beam splitter and movable mirror is a few millimeters which gives about 1% error in frequency spread • Time dependence • Fringes fade in and out near minima position, and because we took 5 separate exposures, it is probable that the images were taken at different relative phases • Incident camera angle • We took the photographs at an angle relative to the index card, shrinking the image ~5% horizontally (cos(θinc)=0.95) • Image compression • Images stored as JPEG files, which results in some compression. This should not be a large source of error, as the JPEG algorithm mostly removes higher frequency brightness variations, which are likely noise.