Download
1 / 18
180 likes | 283 Vues
Learn how to use SAS and JMP to check if data follows a normal distribution. Compare Shapiro-Wilks stats and p-values to determine normality for variables x and y. Analyze and interpret results using JMP's distribution analysis feature.

E N D
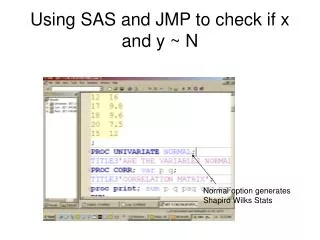
Using SAS and JMP to check if x and y ~ N Normal option generates Shapiro Wilks Stats
Look at p value. If p value >5% then likely that data follows a normal distribution.
Again compare reported p value to alpha of 5%. If greater than 5% cannot reject null that Q “follows a normal distribution”.
In JMP Open table
Highlight P and Q (the two variables being correlated in this problem)
Select normal Go to fit distribution