Download
1 / 3
30 likes | 138 Vues
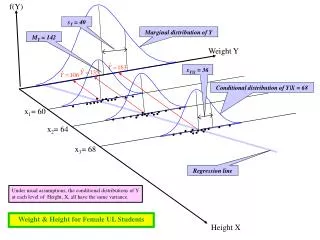
f(Y). s Y = 40. Marginal distribution of Y. M Y = 142. Weight Y. s Y|X = 36. Conditional distribution of Y|X = 68. x 1 = 60. x 2 = 64. x 3 = 68. Regression line. Under usual assumptions, the conditional distributions of Y at each level of Height, X, all have the same variance.

E N D
f(Y) sY = 40 Marginal distribution of Y MY = 142 Weight Y sY|X = 36 Conditional distribution of Y|X = 68 . . . . . . . . . . . . . . . . . . . . . . . . . . . . . x1= 60 . . . . . . . . . . . . . . . . x2= 64 x3= 68 Regression line Under usual assumptions, the conditional distributions of Y at each level of Height, X, all have the same variance. Weight & Height for Female UL Students Height X
f(Y) sY = .8 Marginal distribution of Y MY = 2.6 GPA Y sY|X = .64 Conditional distribution of Y|X = 28 . . . . . . . . . . . . . . . . . . . . . . . . . . . . . x1= 12 . . . . . . . . . . . . . . . . x2= 20 x3= 28 Regression line Under usual assumptions, the conditional distributions of Y at each level of Height, X, all have the same variance. Predicting GPA from ACT ACT X
. yt . . . . . . . . . . . . . . . . . . . . . . . . . . . . . . . . . . . . . . . . . . . . . 0 xt Heteroscedastic pattern of errors The scattered points spread out quite unequally