Download
1 / 16
160 likes | 306 Vues
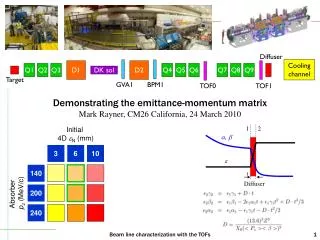
Initial 4D e N (mm). Diffuser. 3. 6. 10. Cooling channel. D1. D2. Q1. Q2. Q3. Q4. Q5. Q6. Q7. Q8. Q9. DK sol. Target. Absorber p z (MeV/c). 140. GVA1. BPM1. TOF0. TOF1. 200. 240. 1. 2. t. a , b. Diffuser. e.

E N D
Initial 4D eN (mm) Diffuser 3 6 10 Cooling channel D1 D2 Q1 Q2 Q3 Q4 Q5 Q6 Q7 Q8 Q9 DK sol Target Absorber pz (MeV/c) 140 GVA1 BPM1 TOF0 TOF1 200 240 1 2 t a, b Diffuser e Demonstrating the emittance-momentum matrixMark Rayner, CM26 California, 24 March 2010 Beam line characterization with the TOFs
Introduction • Purpose of the beam line: • Generate the emittance-momentum matrix elements in pion muon decay beam lines • (3, 6, 10) mm Ä (140, 200, 240) MeV/c • Data taking in December • 6 mm – 200 MeV/c element • Runs 1380 – 1393, Kevin Tilley’s optics, 6k target pulses • 6 mm – 140 MeV/c element • Runs 1409 – 1411, KT’s optics re-scaled to the new momentum, 2k target pulses • Phase space reconstruction by TOF0 and TOF1 • Longitudinal momentum resolution O(5 MeV/c) • Transverse position resolution O(2 cm) • Transverse momentum resolution O(pxmax/70) • Dependent on pxmax, the maximum un-scraped momentum of the optics in question • Comparison with Monte Carlo simulations • The 6-200 element has been simulated using G4BeamLine and G4MICE • This talk • Reconstruction algorithm • Distributions, means, covariance matrices, and emittances for 6-140 and 6-200 data • Analysis talk on Friday • What this means for future stages in MICE Beam line characterization with the TOFs
Selection of the muon peak 6-200 Intermediate momentum 6-140 Beam line characterization with the TOFs
Reconstruction procedure Track through through each quad, and calculate s»leff + dF + dD zTOF1 – zTOF0 = 8 m Assume the path length S»zTOF1 – zTOF0 Q5 Q6 Q7 Q8 Q9 TOF0 TOF1 Estimate the momentum p/E = S/Dt Add up the total path S = s7 + s8 + s9 + drifts Calculate the transfer matrix Deduce (x’, y’) at TOF0 from (x, y) at TOF1 Deduce (x’, y’) at TOF1 from (x, y) at TOF0 Beam line characterization with the TOFs
Momentum reconstruction: 6-200 simulation Path length ! Measuring path length removes the bias on the momentum measurement Beam line characterization with the TOFs
Simulation/data comparison at TOF1 (6-200 matrix element) Muon momentum Muon time of flight This simulation uses the geometry from before TOF1 was moved Dz = – 16.7 cm = – 0.56 ns / c Beam line characterization with the TOFs
6-140 (x, px, y, py, pz) in mm and MeV/c x RMS normalized phase emittance = 5.30 mm y RMS normalized phase emittance = 1.78 mm Transverse 4d RMS normalized phase emittance = 3.07 mm Covariance matrix 4296 -509.0 132.3 -20.37 5.77 4451 -5.34 1.32 168.8 15.13 -438.7 55.8 -7.03 13.65 1286 30.08 -8.49 14.085 0.136 212.8 Means Beam line characterization with the TOFs
6-200 (x, px, y, py, pz) in mm and MeV/c x RMS normalized phase emittance = 5.37 mm y RMS normalized phase emittance = 2.25 mm Transverse 4d RMS normalized phase emittance = 3.48 mm Covariance matrix 3359 -610.0 205.8 18.99 -17.68 3600 1.17 -1.61 82.3 17.43 -107.6 -5.0 -5.84 11.81 602 16.64 -12.09 15.311 -0.407 258.1 Means Beam line characterization with the TOFs
Momentum Beam line characterization with the TOFs
Horizontal phase space 3s fit Beam line characterization with the TOFs
Vertical phase space Beam line characterization with the TOFs
Horizontal spatial dispersion Beam line characterization with the TOFs
Horizontal momentum dispersion Beam line characterization with the TOFs
Vertical spatial dispersion Beam line characterization with the TOFs
Vertical momentum dispersion Beam line characterization with the TOFs
Conclusion • 6-200 element • Trace space beam properties required at TOF1 (6-200) • <pz> = 261.8 MeV/c, ex = 2.55 mm, ey = 1.12 mm, and 4D eN = 1.69 mm • Takes into account binning effects • Trace space beam properties measured at TOF1 (6-200) • <pz> = 258.1 MeV/c, ex = 2.31 mm, ey = 0.93 mm, and 4D eN = 1.47 mm • Phase space beam properties measured at TOF1 (6-200) • <pz> = 258.6 MeV/c, ex = 5.37 mm, ey = 2.25 mm, and 4D eN = 3.48 mm • Phase space beam properties measured at TOF1 (6-140) • <pz> = 212.8 MeV/c, ex = 5.30 mm, ey = 1.78 mm, and 4D eN = 3.07 mm • Analysis talk on Friday • Simulation: how would these beams behave in Stage 6? • What about time? • Suggestion for the future data shifts • Observe >40k muons (~6k target pulses?) for each of the nine elements • Kevin Tilley’s re-scaled 6-200 optics • Optics derived from Marco’s genetic algorithm Beam line characterization with the TOFs