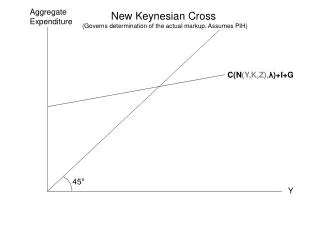
Aggregate Expenditure Components
Aggregate Expenditure Components. CHAPTER 24. © 2003 South-Western/Thomson Learning. Consumption. Consumption both reflects income and depends on income There is a stable and positive relationship between consumption and income both for the household and for the economy.

Aggregate Expenditure Components
E N D
Presentation Transcript
Aggregate Expenditure Components CHAPTER 24 © 2003 South-Western/Thomson Learning
Consumption • Consumption both reflects income and depends on income • There is a stable and positive relationship between consumption and income both for the household and for the economy
Consumption Function • Because consumption depends on income, we say that consumption is a function of income • Consumption is the dependent variable • Disposable income is the independent variable
Marginal Propensities to Consume and Save • What happens to consumption and saving when income changes? • Marginal Propensity to Consume, MPC equals the change in consumption divided by the change in income • Marginal Propensity to Save, MPS equals the change in saving divided by the change in income • MPC + MPS = 1 • This equality exists because all disposable income must either be spent on consumption or saved
Nonincome Determinants • Along a given consumption function, consumer spending depends on the level of disposable income in the economy, other things constant • What are these factors that could cause the entire consumption function to shift? • Net Wealth • Price Level • Interest Rate • Expectations
Net Wealth • Net wealth is the value of all assets that households own minus any liabilities, or debts owed • A decrease in net wealth would make consumers less inclined to spend – more inclined to save the consumption function would shift from C down to C’ in Exhibit 6 • Increase in net wealth increases consumption consumption function would shift from C to C”
Shifts and Movements Along • Difference between a movement along the consumption function and a shift of the consumption function • Movement along the consumption function results from a change in income • Shift of the consumption function results from a change in one of the nonincome determinants of consumption
Price Level • Some household wealth is held in dollar-denominated assets such as bank accounts and cash • Whenever the price level changes, the real value of these dollar-denominated financial assets changes • Increase in the price level reduces the purchasing power of wealth held in fixed dollar assets households consume less and save more • Decreases in the price level increase the purchasing power of wealth held in fixed assets households consumer more and save less
Interest Rate • Interest • The reward savers earn for deferring consumption and, • the cost paid by borrowers for current spending power • The higher the interest rate, the less is spent on items purchased on credit households save more and borrow less consumption function shifts downward • Conversely, a lower interest rate shifts the consumption function upward
Expectations • Expectations influence economic behavior in a variety of ways • Changing expectations about price levels, interest rates, job security and other such factors influence consumer behavior • If expectations become more pessimistic consumption function shifts downward • If expectations become more optimistic consumption function shifts upward
Investment • Investment consists of spending on • New factories and new equipment • New housing • Net change in inventories • Firms invest in capital goods now in the expectation of a future return • Since the return is in the future, investors must estimate how much a particular investment will yield in all years of its productive life
Investment • Firms buy new capital goods only if they expect this investment to yield a greater return than other possible uses of their funds • Recall the distinction between • Gross investment • Net investment
Demand for Investment • The expected rate of return equals the annual dollar earnings expected from the investment divided by the purchase price
Investment • Should the firm invest in golf carts, and if so, how many? • Suppose they plan to borrow the money to buy the carts the number of carts they purchase will depend on the interest rate they must pay to borrow the money • If we now suppose that the market interest rate is 8% per year, the first three carts, all with expected rates of return exceeding 8%, would more than pay for themselves
Investment • The step like relationship indicates the amount to be invested in golf carts at each interest rate • When the interest rate is 8%, profit will be maximized when $6,000 is invested in the carts • The market interest rate is the opportunity cost of investing in capital
From Micro to Macro • Other things constant, more is invested when the opportunity cost of borrowing is lower • With some modifications, the downward sloping demand curve for the entire economy can be derived from a horizontal summation of all industries’ downward sloping investment demand curves
Planned Investment and Income • Investment depends more on interest rates and on business expectations than on the prevailing level of income • One reason for this is that some investments take years to complete • Additionally, investment, once in place, is expected to last for years • Thus, the investment decision is said to be “forward looking,” based more on expected profit than on current levels of income and output
Investment Function • The simplest investment function assumes that planned investment is unrelated to the current level of disposable income • That is, investment is assumed to be autonomous with respect to income planned investment does not vary even though real disposable income does
Investment Function • The investment function isolates the relationship between the level of income in the economy and planned investment – the amount firms would like to invest – other things constant • Two of the determinants of investment that are assumed to be constant are • The market interest rate • Business expectations
Market Interest Rate • In Exhibit 8, when the interest rate was 8%, planned investment is $0.8 trillion shown as I • A decline in the rate of interest from, say 8% to 6%, other things remaining constant, will reduce the cost of borrowing and increase planned investment from $0.8 to $0.9 trillion investment function shifts upward from I to I"
Business Expectations • The primary determinant of investment is business expectations • If firms become more pessimistic about profit prospects, planned investment will decrease at every level of income as shown by the shift in the investment function from I to I’ in Exhibit 9 • On the other hand, if profit expectations become rosier, the investment function will shift upward from I to I”
Business Expectations • Factors that could affect business expectations hence investment would include • Wars • Technological change • Changes in the tax structure • Other destabilizing events that make long-term planning more uncertain
Government Purchase Function • Government purchases in 2001 accounted for about 18% of GDP • One-third of the total was by the federal government • Two-thirds by state and local governments • The government purchase function relates government purchases to the level of income in the economy, other things constant
Government Purchase Function • Because decisions about government purchases are largely under the control of public officials, they do not depend directly on the level of income in the economy • Therefore, we assume that government purchases, G, are autonomous, or independent of the level of income
Transfer Payments • Government purchases represent only one of the components of government outlays • The other is transfer payments • Outright gifts from governments to households and are thus not considered part of aggregate expenditure • Social Security • Welfare benefits and Unemployment benefits • Make up about a third of government outlays • Transfer payments vary inversely with income as income increases, transfer payments decline
Net Taxes • To fund government outlays, governments impose taxes • Taxes vary directly with income as income increase, so do taxes • Net taxes equal taxes minus transfers • Since taxes tend to increase with income while transfers decrease with income, we will assume that net taxes, NT, are autonomous, or independent of income
Net Taxes • Net taxes affect aggregate spending indirectly by changing disposable income, which in turn changes consumption • In our discussion of the circular flow that by subtracting net taxes, we transform real GDP into disposable income
Net Exports • The rest of the world affects aggregate expenditure through imports and exports • The United States, with only one-twentieth of the world’s population – accounts for about one-sixth of the world’s imports and one-eighth of the world’s exports
Net Exports and Income • How do imports and exports relate to the level of income in the economy? • When their incomes rise, Americans spend more on everything including exports and when incomes decline, Americans spend less on imports • How does the value of U.S. exports relate to the economy’s level of income? • The exports purchased by the rest of the world depends on the income of foreigners, not on the U.S. level of income
Net Export Function • The net export function shows the relationship between net exports and the level of income in the economy, other things constant • Since exports are relatively insensitive to the level of U.S. income but our imports tend to increase with income, net exports – Exports minus imports – tend to decline as U.S. income increase • However, for simplicity, we will assume that net exports are autonomous and independent of the level of income
Nonincome Determinants of Net Exports • Factors assumed constant along the net export function include • The U.S. price level • Price levels in other countries • Interest rates here and abroad • Foreign income levels • Exchange rates between the dollar and foreign currencies