Download
1 / 20
220 likes | 378 Vues
Economic and Financial Development of the Republic of Belarus. April 2011. Belarus at a Glance. Area :. 207 ,600 km 2. LATVIA. Population :. 9. 5 million. RUSSIA. LITHUANIA. GDP in 2010. $54 billion. BELARUS. POLAND. Currency :. Belarusian ruble ( BYR), 1 USD ≈ 3000 BYR.

E N D
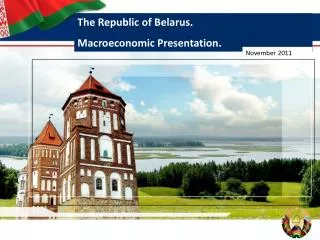
Economic and Financial Developmentof the Republic of Belarus April 2011
Belarus at a Glance Area: 207,600km2 LATVIA Population: 9.5 million RUSSIA LITHUANIA GDPin 2010 $54billion BELARUS POLAND Currency: Belarusianruble (BYR), 1 USD ≈ 3000 BYR UKRAINE CZECHREP. Ratings: B / negative (S&P) B2 /negative (Moody’s) SLOVAKIA
Socially-oriented market economy. Developed export-oriented industryis the basis of the economy • Political stability • Highly qualified workforce. Belarus ranks the 61th in the UN human development index • High rates of economic growth. Average GDP growth rate in 2005-2010 nearly 8percent • Weathering the global economic crisiswell. The economy moved out of recession in the 4th quarter of 2009, GDP grew by 7.6 % in 2010 and by 10,9 % in the first of 2011. • The stability of monetary and banking system has been maintained throughout the crisis. • Sustainable public finances – Belarus has a traditionally balanced budget and low debt burden indicators • Access to capital markets. Successful issue of the debut Eurobonds in August 2010 ($1billion) and in January 2011 ($800 million). Belarus –Introduction
Economic Growth Real GDP growth (%) global crisis recovery Source: National Statistical Committee • GDP has doubled in 2001-2010 • Recovery of economic growth started since Q4 2009. • In 2010 GDP grew by7.6 percent
Inflation and Labor Market CPI inflation (%) Unemploymentand real wages growth (%) Source: National Statistical Committee Source: National Statistical Committee • Due to the anti-crisis measures, inflation has been gradually decreased • In 2010 annual consumer inflation rate stood at 9.9 percent • Significant drop in real wages and growth of unemployment were avoided. Starting from Q3 2010 real wage growth picked up strongly.
Foreign Trade and Current Account Deficit • Higher growth of imports led to deterioration of current account deficit to 15.6 percent ofGDPin 2010 • Export demonstrated robust growth in 2010. Increase by 18.7 percent in 2010 • Reasons for trade balance improvement : • - recovery of demand in major trade partner countries • - improvement of international potash fertilizers market and new contracts • - opening of new markets Current account decomposition Source: National Bank Foreign trade (% change) Source: National Bank
Foreign Trade Structure • Ranks the 3rd in the world by exports of potash fertilizers (nearly 9 % of export of goods in 2010) • 7percent of global tractor market share • 30percent of global rock handler market share Importstructure in2010 (%) Export structure in2010 (%) Source: National Statistical Committee Source: National Statistical Committee
Gross External Debt • Despite significant growth over last 3 years, the gross external debt remains moderate at52.2 percent of GDP • Refinancing risk has declined. Short-term debt share decreased from 70 percent (2007) to 45 percent (December 2010) Gross external debt ($bn) Gross external debt breakdown (%) Source: National Bank Source: National Bank
9 Privatization and FDI Privatizationproceeds ($ mln) Net FDI inflow ($bn) Source: Ministry of Finance • In 2010 improving the legislation and institutions for privatization have been continued: • amendments to the Law on Privatization, bringing it to the international standards • President Decree on the Foundation of the National Agency for Investments and Privatization Source: National Bank • Maininvestor countries: Russia, EU, Switzerland • Net FDI inflow in 2010 was $1.3bn
Monetary Policy Monetary policy presently implemented: targeting of the exchange rate of BYR Since January 2009 the BYR has been pegged to the currency basket consisting of USD, EUR and RUB taken with equal weights The main goal of the interest rate policy is keeping the real interest rates at positive levels Since April, 2011 the refinancing rate is set at 13 percent Average exchange rate of BYR to USD and EUR Source: National Bank Exchange rate of BYR to the currency basket Level of interest rates (%) Source: National Bank Source: National Bank
Banking Sector • Key data relating to the banking sector as of January1, 2011: • number of banks 31, including 26 with foreign capital • total assets accounting to $43.7 bn • total banks’ claims to the economy accounting to $29.6 bn • - Owned capitalaccounting to $5.8 bn • average ROA accounting to 1.7 percent • Share of problematic assets – 3.6 % • Capital adequacy ratio – 20.5 % Assets and banks’ claims (annual average, % of GDP) Largest foreign investors: Source: National Bank As of January 1, 2011 the share of foreign capital in the total authorized capital of the banking sector reached 24.2 percent
Consolidated Budget • Consolidated budget revenues doubled over last 5 years • Consistent decrease in overall tax burden: 6.8 percentGDP in 6 years (down to 27.5 percent of GDP) • Stability and sustainability of the Social Protection Fund • Sustainable growth of non-taxable income Revenue structure of consolidated budget * (% of GDP) * Exclusive of export duties on oil products applied in 2007 – 2009, which were subsequently reimbursed to the payers from the budget ** Starting from 2010 SPF is excluded from the consolidated budget Source: Ministry of Finance
Revenues and Expenditures of ConsolidatedBudget 13 Revenuesstructure (2010, %) • VAT is the main source of tax revenues • Interest payments on public debt account for only 2 percent of budget spending • In 2010 consolidated budget revenues were 29.9 % of GDP, consolidated budget expenditures – 32.5 % of GDP. • The budget centralization level is in line with the Central European average Source: Ministry of Finance Expenditures structure (2010, %) Source: Ministry of Finance
Fiscal Policy • Main features ofstate budget in 2011: • Reduction of the tax burden and further simplification of the tax administration • Considerable growth of social expenditures at the cost of increase of ages, salaries, pensions and grants as well as providing the other social guarantees for the population • Retaining the level of supporting of the economy and stimulating its innovation development Consolidated budget balance (% of GDP) Source: IMF, Ministry of Finance
Public Debt Publicdebt (% of GDP) • as of January 1, 2011 the total public debt (including guarantees) accounted for US$ 20.3 bn or 37.4 percent of GDP • as of January 1, 2011 external public debt was 17.8 percent of GDP, domestic public debt – 19.6 percent of GDP • around 52 percent of public debt is denominated in local currency • legislative ceiling for external public debt is 25 percent of GDP, for domestic public debt – 20 percent of GDP Source: Ministry of Finance Publicdebt (% of GDP) Source: Ministry of Finance
External Public Debt Sources of external public debt (%) • As of1 January 2011 external public debt accounted for $9.7 bn or 17.8 percent of GDP: • - 87 percent of external public debt is represented by official bilateral and multilateral loans • - average maturity is 5.2 years • - average rate of interest is 3.6 percent • - proportion to be repaid in 12 month – 2.1 percent Source: Ministry of Finance, as of December 1, 2010 Public debt (% of GDP) Currency structure of external public debt (%) Source: Ministry of Finance Source: Ministry of Finance, as of December 1, 2010
External Public Debt External public debt repayments ($bn) “Government debt is expected to remain at manageable levels” (IMF, March26, 2010) • Debt strategy objectives: • keeping the public debt at manageable levels • building the yield curve for external borrowings of corporate sector • diversification of debt raising instruments • - developing ties with international investor community Source: Ministry of Finance
Strong Economic Fundamentals Relative to Peers GDPper capita (thousands$, 2010) budget deficit (% of GDP, 2010) Source: S&P, IMF, Ministry of Finance Source: S&P, IMF, Ministry of Finance Gross externaldebt (% of receipts of current account, 2010) Publicdebt (% of GDP, 2010) Source: S&P, IMF, Ministry of Finance Source: S&P, IMF, Ministry of Finance
Anti-crisis measures in 2011 • 1) Economic policies aimed at reduction of domestic demand: • tightening of monetary policy by raising refinancing rate and interest rates on the National Bank’s instruments, keeping the real interest rates positive • further tightening of fiscal policy. The possible reduction of budget deficit due to the planned additional measures on reduction of expenditures and raising revenues in 2011 is estimated at 1.5 % of GDP. • 2) Stepping-up efforts on attraction of foreign direct investment, including privatization-related FDI • 3) Closing external financing gap by attraction anti-crisis credits from the Russian Federation and Euro-Asian Economic Community’s Anti-Crisis Fund in the total amount of 3 billion US$.
Medium-to-Long-term Priorities in Economic Policy • Strengthening of structural reforms, acceleration of privatization and inflow of FDI • Further liberalization of the economy and improvement of the business environment • Active modernization of the economy. Further development of innovative competitive enterprises • Maintaining stable growth rates • Strengthening resistance to external shocks • Ensuring stability of the budget combined with safe and manageable level of public debt • Ensuring a stability of banking and financial system • Strengthening of business ties with the CIS and EU