Download
1 / 20
220 likes | 355 Vues
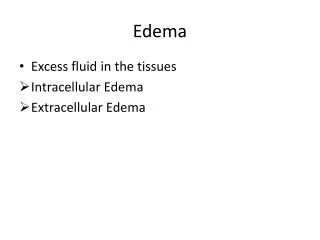
Phase 3 Short-term. Diuretic Treatment of Edema – Week 24. 3 - 3 - 42. Heart Failure vs. Edema. Phase 2 and 3 Short-term and Long-term. † Data available for phase 3 only. 4 - 54. Microscopic Hematuria – Urology Consultations. Phase 2 and 3 Short-term and Long-term.

E N D
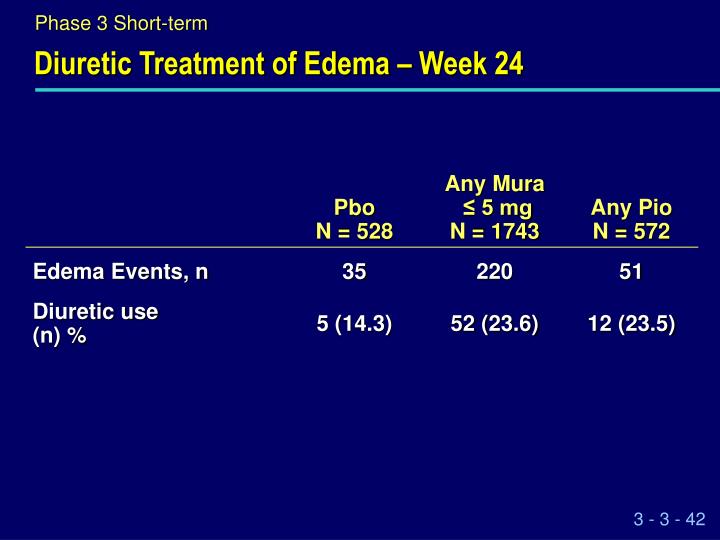
Phase 3 Short-term Diuretic Treatment of Edema – Week 24 3 - 3 - 42
Heart Failure vs. Edema Phase 2 and 3 Short-term and Long-term †Data available for phase 3 only 4 - 54
Microscopic Hematuria – Urology Consultations Phase 2 and 3 Short-term and Long-term Subjects Referred to Urologic Consultation (N = 89) Completed Consultation (N = 85) • Did Not Complete Consultation (N = 4): • 3 refused consultation • 1 discontinued early from study Normal Consults (N = 41) • Clinical Findings (N = 44): • Kidney stones (N = 11) • Infections (N = 9) • Prostate disease (N = 5) • Inflammation (N = 5) • Bladder cancer (N = 2)† • More than 1 finding (N = 4) • Miscellaneous (N = 8)†† † 2 additional bladder cancers (recurrences) † † e.g. Pyuria, suture materials, urethral obstruction, cystic cystitis 3 - 1 - 12
Placebo-controlled Studies, Short-term Urine Crystals: Baseline and On-study Incidence -24 Weeks % of Subjects 018, 021ST, 022ST pooled 3 - 1 - 9
Urolithiasis Incidence Phase 2 and 3 Short-term and Long-term Incidence per 1,000 patient-years (n) 3 - 1 - 14
Summary – Bladder Cancer Phase 2 and 3 Short-term and Long-term • 4 cases (2 on Mura, 2 on Pio) • 2 recurrent cases • Mura 10 mg – onset D58 • Pio 15 / 45 mg – onset D256 • 2 new-onset cases • Mura 10 mg – onset D573 • Relevant PMH: microscopic hematuria at baseline, smoking history • Pio 30 mg – onset D170 • Relevant PMH: foundry, carpet warehouse worker • Males, age range 62-71 years • 2 subjects with history of smoking • 3 cases identified as superficial or non-invasive 3 - 1 - 17
Observed and Expected Incidence Rates for Bladder Cancer Phase 2 and 3 Short-term and Long-term aPharMetrics Research Database – Integrated claims from 2000-2003 3 - 1 - 15
Monotherapy Studies Change from Baseline in A1C by Quartiles of Change from Baseline in Weight at Week 24 (LOCF) Muraglitazar 5 mg B/L in Weight (kg) n = Baseline Mean (%) ≤ 0 127 8.47 0 – 2.0 93 8.69 2.0 – 4.1 107 8.66 >4.1 108 9.0 A1C (%)With95% CI -1.24 -1.23 -1.50 -2.11 006 ST, 018 ST + OL 3 - 5 - 20
In db/db Mice, Muraglitazar Improves Insulin Sensitivity, Increases Insulin Content in the Pancreas oGTT Pancreas – Insulin Glucose (mg/dL) Insulin (ng/mL) • db/db mice (~10 week old) were treated for2 weeks; Animals were overnight fasted.* p < 0.05 vs vehicle Minutes After Glucose Administration 8 - 27
Muraglitazar Prevents Loss of Pancreatic Islet Insulin Content in Pre-Diabetic db/db Mice Insulin (islet) Insulin (pancreas) Vehicle Mura (10 mg/kg) • ~ 5 week old db/db mice were treated for 12 weeks; Insulin staining after 8 weeks • Animals were fasted overnight. *p <0.05 vs vehicle 8 - 30
White Black Study Dose Other Mura 5 CV168006 CV168018 Mura 2.5 Mura 5 CV168021 Mura 2.5 + Gly Mura 5 + Gly CV168022 Mura 2.5 + Met Mura 5 + Met CV168025 Mura 5 + Met -2.0 -1.5 -1.0 -0.5 0.0 0.5 Change from Baseline A1C (%) Plot of Mean Change from Baseline in A1C at Week 24 (LOCF) by Race 1g - 1
Hispanic/Latino Study Dose Mura 5 CV168006 Non-Hispanic/Latino CV168018 Mura 2.5 Mura 5 CV168021 Mura 2.5 + Gly Mura 5 + Gly CV168022 Mura 2.5 + Met Mura 5 + Met CV168025 Mura 5 + Met -2.0 -1.5 -1.0 -0.5 0.0 0.5 Change from Baseline A1C (%) Plot of Mean Change from Baseline in A1C at Week 24 (LOCF) by Ethnicity 1h - 1
Number (%) of Subjects Reporting Edema AEs by Subgroup Phase 2 and 3, Short-term 1g - 3
Mura 0.5 mg Mura 1.5 mg Mura 5 mg Mura 10 mg Mura 20 mg Pio 15 mg Mean Hemoglobin Levels Over Time – Week 24 Dose-Ranging Study Hemoglobin (g/dL) Week Study 006 ST 3 - 7 - 25
AEs of Anemia – 24 Weeks Phase 2 and 3, Short-term • 1 SAE of anemia on muraglitazar 5 mg (GI bleeding) • 1 SAE of anemia on pioglitazone 30 mg (gastric bleeding) • 2 subjects on muraglitazar were discontinued due to anemia 3 - 7 - 32
Change from Baseline in ANC at Week 24 Dose-Ranging Study Muraglitazar Study 006 ST 3 - 7 - 5
Number (%) of Subjects with ANC < 1000on 2 Consecutive Visits • No cases were associated with clinical sequelae • 2 subjects on muraglitazar discontinued Phase 2 and 3 ST + 006 LT 3 - 7 - 2
CV Mortality in Combination Therapy Studies Events / 1000 PY Exposure (n) HR = hazard ratio relative to Pbo / Pio. SA - 39
Cardiovascular Risk Factors in Subjects with and without a CV Event 3 - 11 - 54
Cardiovascular Risk Factors at Baseline in Subjects with and without a CV Event 3 - 11 - 55