Download
1 / 43
480 likes | 1.34k Vues
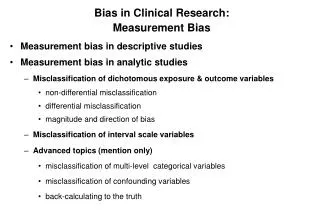
Bias in Clinical Research: Measurement Bias. Measurement bias in descriptive studies Measurement bias in analytic studies Misclassification of dichotomous exposure & outcome variables non-differential misclassification differential misclassification magnitude and direction of bias

E N D
Bias in Clinical Research: Measurement Bias • Measurement bias in descriptive studies • Measurement bias in analytic studies • Misclassification of dichotomous exposure & outcome variables • non-differential misclassification • differential misclassification • magnitude and direction of bias • Misclassification of interval scale variables • Advanced topics (mention only) • misclassification of multi-level categorical variables • misclassification of confounding variables • back-calculating to the truth
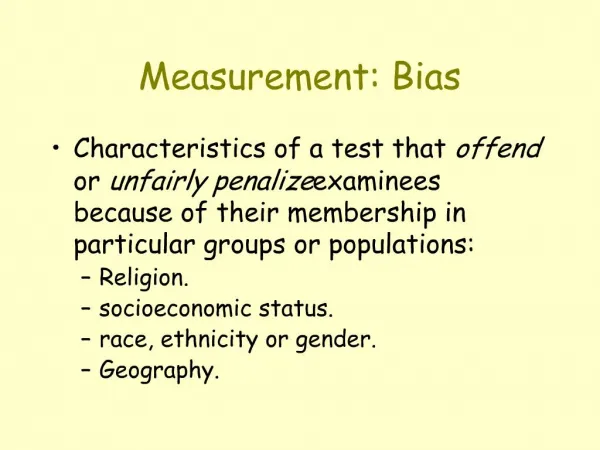
Measurement Bias • Definition • bias that is caused when any measurement collected about or from subjects is not completely valid (accurate) • any type of variable: exposure, outcome, or confounder • aka: misclassification bias; information bias (text); identification bias • misclassification is the immediate result of an error in measurement
Misclassification of Dichotomous Variables: Terms Related to Measurement Validity Positive predictive value = a/(a+b) Negative predictive value = d/(c+d) • Sensitivity • the ability of a measurement to identify correctly those who HAVE the characteristic (disease or exposure) of interest. • Specificity • the ability of a measurement to identify correctly those who do NOT have the characteristic of interest • Applies to any dichotomous variable, not just diagnoses
Causes for Misclassification • Questionnaire problems • inaccurate recall • socially desirable responses • ambiguous questions • under or overzealous interviewers • Biological specimen collection • problems in specimen collection or processing or storage • Biological specimen testing • inherent limits of detection • faulty instruments • Data management problems in coding • Design or analytic problems • incorrect time period assessed • lumping of variables (composite variables)
Descriptive Study: Measurement Bias 1982 California Governor Election Bradley +7% SOURCE POPULATION = CALIFORNIA Deukmejian STUDY SAMPLE = PRE-ELECTION POLL (Field Poll)
Descriptive Study: Measurement Bias 1982 California Governor Election Bradley 48% “Bradley Effect” = Respondents who favored Deukmejian sought to avoid appearing racist and hence did not state their true choice during polling Deukmejian 49% Bradley +7% SOURCE POPULATION = CALIFORNIA Deukmejian STUDY SAMPLE = PRE-ELECTION POLL (Field Poll)
Contrast with Selection Bias Uneven dispersion of arrows e.g., Dewey backers were over-represented SOURCE POPULATION STUDY SAMPLE
Non-Differential Misclassification of Exposure: Imperfect Sensitivity Diseased Problems with sensitivity in the measurement of exposure - independent of disease status + - + - Exposed Evenly shaded arrows = non-differential SOURCE POPULATION e.g., case-control study exposure = alcohol abuse STUDY SAMPLE
Non-differential Misclassification of Exposure Truth: No misclassification (100% sensitivity/specificity) Exposure Cases Controls Yes 50 20 No 50 80 OR= (50/50)/(20/80) = 4.0 Presence of 70% sensitivity in exposure classification Exposure Cases Controls Yes 50-15=35 20-6=14 No 50+15=65 80+6=86 OR= (35/65)/(14/86) = 3.3 Effect of non-differential misclassification of dichotomous exposures: Bias the OR toward the null value of 1.0
Non-Differential Misclassification of Exposure: Imperfect Specificity Diseased e.g., exposure = self-reported second-hand smoke exposure + - + - Exposed SOURCE POPULATION Problems with specificity of exposure measurement - independent of disease status STUDY SAMPLE
Non-differential Misclassification of Exposure Truth: No misclassification (100% sensitivity/specificity) Exposure Cases Controls Yes 50 20 No 50 80 OR= (50/50)/(20/80) = 4.0 Presence of 70% specificity in exposure classification Exposure Cases Controls Yes 50+15=65 20+24=44 No 50-15=35 80-24=56 OR= (65/35)/(44/56) = 2.4 Effect of non-differential misclassification of dichotomous exposures: Bias the OR toward the null value of 1.0
No misclassification Diseased e.g., exposure = self-reported second-hand smoke exposure + - + - Exposed SOURCE POPULATION 50 20 50 80 OR = 4.0 STUDY SAMPLE
Non-Differential Misclassification of Exposure: Imperfect Specificity Diseased e.g., exposure = self-reported second-hand smoke exposure + - + - Exposed SOURCE POPULATION differences become blurred 44 65 35 80 56 50 OR = 2.4 STUDY SAMPLE
Non-Differential Misclassification of Exposure: Imperfect Specificity and Sensitivity Diseased + - Problems with sensitivity - independent of disease status + - Exposed SOURCE POPULATION Problems with specificity - independent of disease status STUDY SAMPLE
Non-Differential Misclassification of Exposure: Imperfect Sensitivity and Specificity Exposure Cases Controls Yes 80 50 No 20 50True OR = (80/20) / (50/50) = 4.0 True Cases Controls Distributionexp unexp exp unexp (gold standard) 80 20 50 50 Study distribution: Cases Controls Exposed 56 6 62 35 15 50 Unexposed 24 14 38 15 35 50 sensitivity 0.70 0.70 0.70 0.70 or specificity Exposure Cases Controls Yes 62 50 No 38 50 Observed OR = (62/38) / (50/50) = 1.6 SOURCE POPULATION Sensitivity = 0.7 Specificity = 0.7 STUDY SAMPLE
Non-Differential Misclassification of Exposure: Imperfect Sensitivity and Specificity Exposure Cases Controls Yes 80 50 No 20 50True OR = (80/20) / (50/50) = 4.0 True Cases Controls Distributionexp unexp exp unexp (gold standard) 80 20 50 50 Study distribution: Cases Controls Exposed 72 4 76 45 10 55 Unexposed 8 16 24 5 40 45 sensitivity 0.90 0.80 0.90 0.80 or specificity Exposure Cases Controls Yes 76 55 No 24 45 Observed OR = (76/24) / (55/45) = 2.6 SOURCE POPULATION Sensitivity = 0.9 Specificity = 0.8 STUDY SAMPLE
Non-Differential Misclassification of Exposure: Imperfect Sensitivity & Specificity and Uncommon Exposure e.g. radon exposure Exposure Cases Controls Yes 50 20 No 500 800True OR = (50/500) / (20/800) = 4.0 True Cases Controls Distributionexp unexp exp unexp (gold standard) 50 500 20 800 Study distribution: Cases Controls Exposed 45 100 145 18 160 178 Unexposed 5 400 405 2 640 642 sensitivity 0.90 0.80 0.90 0.80 or specificity Exposure Cases Controls Yes 145 178 No 405 642 Observed OR = (145/405) / (178/642) = 1.3 SOURCE POPULATION Sensitivity = 0.9 Specificity = 0.8 STUDY SAMPLE
Sensitivity Specificity Prev of Exp in controls Observed OR 0.90 0.85 0.20 2.6 0.60 0.85 0.20 1.9 0.90 0.95 0.20 3.2 0.90 0.60 0.20 1.9 0.90 0.90 0.368 3.0 0.90 0.90 0.20 2.8 0.90 0.90 0.077 2.2 Non-differential Misclassification of Exposure: Magnitude of Bias on the Odds RatioTrue OR=4.0
Bias as a function of non-differential imperfect sensitivity and specificity of exposure measurement 2.8 2.5 2.2 1.9 1.6 1.3 1.0 True OR = 2.67 Prevalence of exposure in controls = 0.2 Sensitivity of exposure measurement 0.9 0.7 0.5 Apparent Odds Ratio Copeland et al. AJE 1977 .50 .55 .60 .65 .70 .75 .80 .85 .90 .95 1.00 Specificity of exposure measurement
Bias as a function of non-differential imperfect sensitivity and specificity of exposure measurement 2.8 2.5 2.2 1.9 1.6 1.3 1.0 True OR = 2.67 Prevalence of exposure in controls = 0.2 Sensitivity of exposure measurement 0.9 0.7 0.5 Apparent Odds Ratio When does OR fall below 2? Copeland et al. AJE 1977 .50 .55 .60 .65 .70 .75 .80 .85 .90 .95 1.00 Specificity of exposure measurement
Non-Differential Misclassification of Exposure in a Cohort Study: Effect of Sensitivity, Specificity and Prevalence of Exposure All RR < 8 If Pe >.25, ↑ Sn. influ. Dependence upon Pe Apparent Risk Ratio True Risk Ratio = 10 U = sensitivity; V = specificity Flegal et al. AJE 1986
Non-Differential Misclassification of Exposure: Rules of Thumb Regarding Sensitivity & Specificity Exposure Cases Controls Yes 50 100 No 50 300True OR = (50/50) / (100/300) = 3.0 SOURCE POPULATION Sens + Spec >1 but <2 gives attenuated effect Sens + Spec = 1 gives OR = 1 (no effect) Sens + Spec < 1 gives reversal of effect Coding error
Non-Differential Misclassification of Outcome Diseased + - Problems with outcome sensitivity -independent of exposure status + - Exposed SOURCE POPULATION Evenly shaded arrows = non-differential Problems with outcome specificity - independent of exposure status STUDY SAMPLE
Bias as a function of non-differential imperfect sensitivity and specificity of outcome measurement in a cohort study Apparent Risk Ratio True risk ratio = 2.0 Cumulative incidence in unexposed = 0.05 Sensitivity of outcome measurement 0.9 0.7 0.5 Steep bias with change in specificity Relatively less influence from sensitivity Specificity of outcome measurement Copeland et al. AJE 1977
Non-Differential Misclassification of Outcome: Effect of Incidence of Outcome Apparent Risk Ratio True risk ratio = 2.0 Sensitivity of outcome measurement held fixed = 0.9 Cumulative incidence of outcome Exposed Unexposed 0.2 0.1 0.1 0.05 0.05 0.025 Specificity of outcome measurement Copeland et al. AJE 1977
Special Situation In a Cohort or Cross-sectional Study Misclassification of outcome • If specificity of outcome measurement is 100% • Any degree of imperfect sensitivity, if non-differential, will not bias the risk ratio or prevalence ratio • e.g., • Risk difference, however, is changed by a factor of (1 minus sensitivity), in this example, 30% (truth=0.1; biased = 0.07) Truth 70% sensitivity
When specificity of outcome is 100% in a cohort or cross-sectional study Apparent Risk Ratio True risk ratio = 2.0 Cumulative incidence in unexposed = 0.05 Sensitivity of outcome measurement 0.9 0.7 0.5 Specificity of outcome measurement Copeland et al. AJE 1977
When specificity of outcome measurement is 100% in a cohort or cross sectional study • Worth knowing about when choosing outcomes, such as cutoffs for continuous variables on ROC curves • Choosing most specific cutoff (or 100% cutoff) will lead to least biased ratio measures of association
Efficacy of a pertussis vaccine • Acellular vaccine vs. control (hepatitis A vaccine) for the prevention of pertussis in adults (Ward et al. NEJM 2005) • Outcome: Cough > 5 days • No. of events: 2672 (and apparently lots of “power”) • Result: No significant difference between groups • Outcome: Cough + microbiologic pertussis confirmation • No. of events: 10 • Result: rate ratio = 0.08 (92% vaccine efficacy) (95% CI = 0.01 to 0.68)
Pervasiveness of Non-Differential Misclassification • Direction of this bias is towards the null • Therefore, called a “conservative” bias • Goal, however, is to get the truth • Consider how much underestimation of effects must be occurring in research • How many “negative” studies are truly “positive”?
Differential Misclassification of Exposure Weinstock et al. AJE 1991 • Nested case-control study in Nurses Health Study cohort • Cases: women with new melanoma diagnoses • Controls: women w/out melanoma - by incidence density sampling • Measurement of exposure: questionnaire about self-reported “tanning ability”; administered shortly after melanoma development
Question asked after diagnosis • Question asked before diagnosis (NHS baseline) Virtually unchanged Substantially changed
“Tanning Ability” and Melanoma: Differential Misclassification of Exposure Melanoma + - Imperfect specificity of exposure measurement - mostly in cases No Yes Tanning ability Bias away from the null leading to spurious association SOURCE POPULATION STUDY SAMPLE
Differential Misclassification of Exposure: Exposures During Pregnancy and Congenital Malformations Congenital Malformation + - + - Cases more likely than controls to remember a variety of exposures Exposed SOURCE POPULATION Uneven shading of arrows = differential Cases might be more likely than controls to falsely state a variety of exposures STUDY SAMPLE
Differential Misclassification of Exposure: Magnitude of Bias on the Odds RatioTrue OR=3.9
Misclassification of Dichotomous Exposure or Outcome: Summary of Effects
Relating Last Week to This Week:Relating Reproducibility/Validity of Individual Measurements to Measurement Bias in Inferences in Analytic Studies • Validity • How sensitivity and specificity of a measurement results in measurement bias covered in prior slides • How about reproducibility? • Recall that a measurement with imperfect reproducibility will lack perfect validity --unless it is repeated many, many times • imperfect reproducible measurement will lead to biased inferences when using the measurement
Reproducibility and Validity of a Measurement With only one shot at the measurement, most of the time you will be off the center of the target
Imperfect reproducibility leads to 90% sensitivity and 90% specificity of height measurement –non-differential with respect to outcome
Relating the Reproducibility and Validity of Measurements to Measurement Bias in Analytic Studies – Interval Scale Variables Validity (Systematic error) • Result moves systematically up or down scale by given factor or absolute difference • e.g., systematic error in an interval scale outcome variable Mean Ratio of Means Difference in Means Bias depending upon measure of association
Relating the Reproducibility and Validity of Measurements to Measurement Bias in Analytic Studies – Interval Scale Variables Truth and Error Truth Reproducibility (Random error) e.g., random error in a predictor variable Assuming: • Exposure is normally distributed with variance, 2True • Random error is normally distributed with variance, 2E • Then, the observed regression coefficient is equal to the true regression coefficient times: • i.e., the greater the measurement error, the greater the attenuation (bias) towards the null (e.g., if ICC is 0.5, the measure of association is halved) (i.e. reproducibility, the intraclass correlation coefficient)
Advanced Topics • Misclassification of multi-level categorical variables • some of the rules change regarding direction of bias • Misclassification of confounding variables • net result is failure to fully control (adjust) for that variable (left with “residual confounding”) • measures of association may be over or under-estimated • Back-calculating to unbiased results (Quantitative bias analysis) • thus far, truth about relationships have been assumed • in practice, we just have observed results • when extent of classification errors (e.g., PPV, NPV, sensitivity & specificity) are known, it is possible to back-calculate to truth • if exact classification errors are not known, it is possible to perform sensitivity analyses to estimate a range of study results given a range of possible classification errors
Managing Measurement Bias • Prevention and avoidance are critical • study design phase is critical; little to be done after study over • Become an expert in the measurement of your primary variables • For the other variables, seek out the advice of other experts • Optimize the reproducibility/validity of your measurements! Good Reproducibility Good Validity Poor Reproducibility Poor Validity