Download
1 / 12
120 likes | 273 Vues
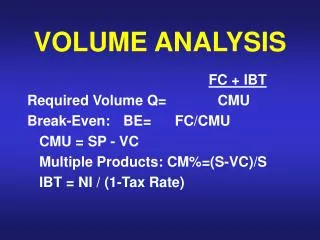
Losses and Ancillary Services: Volume Analysis. 2007 Budget Review Process August 28, 2007 Operations Planning. 2007 GTA, Losses and Ancillary Services. Presentation and Agenda: Overview Forecast the volumes and costs of losses in 2008 Forecast the volumes ancillary services in 2008

E N D
Losses and Ancillary Services: Volume Analysis 2007 Budget Review Process August 28, 2007 Operations Planning
2007 GTA, Losses and Ancillary Services Presentation and Agenda: • Overview • Forecast the volumes and costs of losses in 2008 • Forecast the volumes ancillary services in 2008 • Year-to-date Actual vs. Forecast Comparison • Methodology of forecasting Losses and AS – evolving process • Summary Discussion
Overview – 2008 Business Review Process Costs for Losses and Ancillary Services (AS) are based on a volume forecast using: • Latest 2008 Alberta Internal Load forecast (includes behind the fence loads (BTF) and new DTS contracts) • 2008 grid facility profile (existing, new, decommissioned) • Latest TMR forecast as per OPP’s • Updated generation stacking order based on latest 12 months actual dispatch behavior of generators, and Import/Export • A north/south model includes export ATC based on SOK transfer limit
2008 Forecast of Losses – Cost and Volume Analysis • Hourly forecasted loss volumes calculated based on: • Historical actual loss volumes from the AESO settlement system • A forecasting model using the historical data • The losses volumes are re-calculated three additional times per year (to fulfill the calibration factor process) • Annual forecasted loss volume can be computed by summing hourly forecasted loss volumes • Hourly forecasted loss cost is: Σ (forecasted loss volume X forecasted pool price) hourly • Estimated cost for 2008 = $251.4 M, based on 2.9101 TWH • 2007 Forecast: $196.1 M @ 2.897 TWH
2007 YTD – Loss Comparison • Based on the 2007 GTA losses forecast submission • Actual data is settled as: Initial, Interim, and Final
2007 YTD – Loss Comparison (…2) • The overall summary is estimated below (losses update in June 2007, • price forecast from August 20 2007):
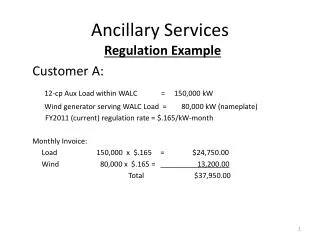
2008 Forecast of AS (Operating Reserves and TMR) – Volume Analysis • AESO carries operating reserves to ensure reliability during loss of generation. Requirements set by WECC and NWPP • Operating reserves include regulating, spinning and supplemental reserve • Described in OPP-401 and OPP-402, AESO procures each type of operating reserve in two portfolios: Active (normal), Standby (used when Active portfolio is insufficient due to forecast accuracy issues/forced outages) • Not included in the forecast: • Frequency Responsive Reserves • Wind Variability
2008 Forecast of AS – Volume Analysis (…2) • Volume of reserves procured based on load forecast, with no consideration given to resource mix • Transmission Must Run (TMR) based on hourly load forecast (Rainbow and northwest) and OPP 501, 510 (Calgary Operation) • AS cost analysis by Commercial Services
Methodology of Forecasting Losses and Ancillary Services • The AESO reviews it’s tools and data sources continuously and makes improvements to achieve better forecasts and more efficient use of time • More data for historical analysis is utilized • Improved database techniques • In 2007, the Losses and Ancillary Service volume forecast appears on track to be within 1-2% of actual levels • The AESO will use the same process in the 2008 GTA submission – better data and tools will be used where warranted
Summary: Losses • The 2007 forecast and 2007 actual loss results (YTD) are similar • The loss volumes from 2007 to 2008 are similar (2.897 TWH vs. 2.910 TWH). The result makes sense because there are no major system changes expected • The major cause of the change from ~$196M to ~$251M is the pool price (beginning of year forecast average moves from ~$66 in 2007 to ~$84/MWH in 2008)
Summary: Ancillary Services • The forecast for 2008 is similar to actual levels from the past several years • The slightly higher values in the active market in 2007 is likely the result of a mid-year view. • FRR has not yet been determined. Regulation Reserve implementation for wind has not yet been decided. AS will be modified as these items are addressed and implemented