Download
1 / 9
90 likes | 400 Vues
Ultraviolet-Visible S pectroscopy in the Detection of Nitrogen Oxide Air Pollutants. Nitrogen Oxides Pollution. NO x f orms from emissions from vehicles, power plants, and off-road equipment Adverse Effects: Formation of ground level ozone in the presence of heat of sunlight

E N D
Ultraviolet-Visible Spectroscopy in the Detection of Nitrogen Oxide Air Pollutants
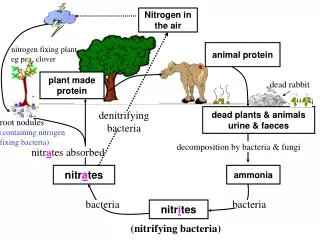
Nitrogen Oxides Pollution • NOxforms from emissions from vehicles, power plants, and off-road equipment • Adverse Effects: • Formation of ground level ozone in the presence of heat of sunlight • Airway inflammation and increased respiratory symptoms in asthma patients Nitrogen Dioxide Ozone
EPA Regulation • EPA sets national standard for nitrogen oxide ambient air concentrations to 53 ppb (annual average) • Decreased by more than 40% since 1980 • Expected to decrease further as mobile source regulations that are taking effect • Ultraviolet-visible (UV-Vis) spectroscopy can determine the concentration of nitrogen oxides.
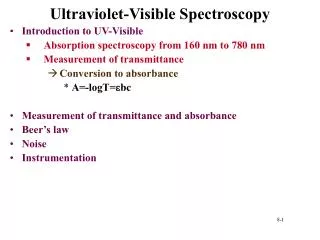
Ultraviolet-Visible Spectroscopy • Molecular absorption due to excitation of bonding electrons • Can identify functional groups • Can quantify compounds with absorbing groups • The lowest energy transition is the HOMO-LUMO gap in the ground state (DE). • If energy of light exactly matches DE, photon can be absorbed • More conjugated systems have smaller HOMO-LUMO gap • Have lower DE and absorb longer wavelength of light
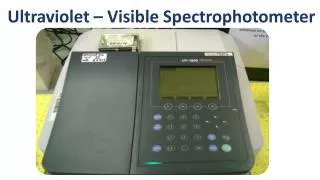
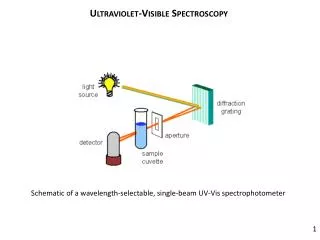
UV-Vis measurements • Sample dissolved into a non-absorbing solvent • Sample placed in cell • A cell of pure solvent is also analyzed as control • Monochromatic light (190 nm- 800nm) is passed through cell • Intensity of light transmitted is detected • Wavelength varied to test absorption at different energies
Ultraviolet-Visible Spectroscopy • Light transmitted (T) through the sample: T = (I/I0) I=Light intensity I0=Initial light intensity • Beer-Lambert Law of Absorbance (A): A = -log(I / I0) = εbc ε= molar absorptivity (L/mol*cm) b=pathlength of sample cell (cm) c=concentration of compound (mol/L)
Gas Chromatography-UV-Vis • Sample evaporated into gas phase • Sample injected into column • Analytes interact with stationary phase in column to different extents • Allows separation of different analytes • Detection by UV-Vis
Advantages/DisadvantagesUV-Vis detection for GC • Advantages: • General indicator of functional groups • Minimal damage to sample • Good quantitation • Using GC eliminates solvent effects • Disadvantages: • Lack of sensitivity & selectivity • Limited to UV-Vis absorbing compounds