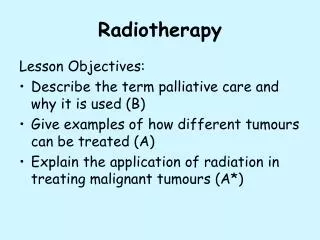
Texture Analysis for Radiotherapy
31 st of Dec, 2013. Texture Analysis for Radiotherapy. So- Yeon Park vsoyounv@gmail.com. Contents. 1. What is the Texture? 2. Texture Analysis 3. Application of Texture Analysis for Radiotherapy (paper review) 4. Future Research (What can we do?) 5. Conclusion . What is the Texture??.

Texture Analysis for Radiotherapy
E N D
Presentation Transcript
31st of Dec, 2013 Texture Analysis for Radiotherapy So-Yeon Park vsoyounv@gmail.com
Contents 1. What is the Texture? 2. Texture Analysis 3. Application of Texture Analysis for Radiotherapy (paper review) 4. Future Research (What can we do?) 5. Conclusion
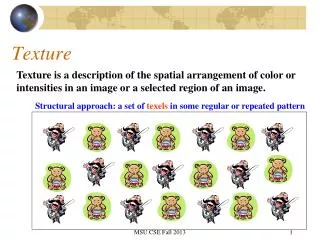
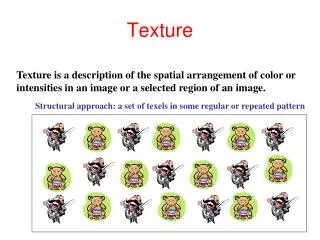
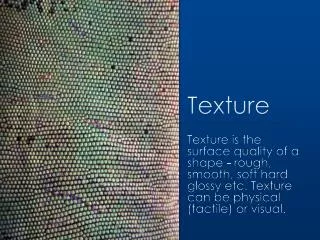
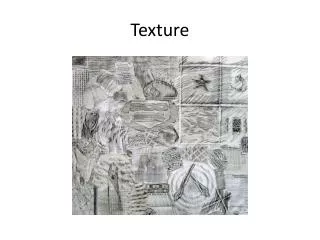
What is the Texture?? CT • Regular repetition of an element orpatternon a surface • With the characteristics of brightness, color, shape, size, etc. • Similarity grouping in an image (group of pixels is ‘texels’) Wood Metal
Texture Analysis • Texture analysis is a major step in - texture classification - image segmentation - image shape identification
Mathematical procedures to characterize texture fall into two major categories, 1. Statistical and 2. Syntactic
Mathematical procedures to characterize texture fall into two major categories, 1. Statistical and 2. Syntactic
Statistical methods • First-order (one pixel) - properties of individual pixel values (average & variance) - ignore the spatial interaction b/w image pixels • Second-order (two pixels) - properties of two pixel values occurring at specific locations relative to each other - Co-occurrence matrices • Higher-order (three or more pixels) - properties of more pixel values
First-order statistics • Grey-level histogram - the intensity value concentration on all or part of an image - many clues to characteristics of the images • Common features - mean and variance - mean square value - average of intensity - entropy - skewness and kurtosis <Grey-level histogram>
Second-order statistics • Grey-level co-occurrence matrix (GLCM) - how often each gray level occurs at a pixel located at a fixed position relative to each other pixel - (1,3) entry : probability of finding gray level 3 to the right of pixel with gray level 1 • Common features - Homogeneity - local entropy - to characterize spatial patterns of an image <GLCM>
Paper review • Application of texture analysis for radiotherapy 1. automated radiation targeting (Yu et at., Nailon et al.) 2. assessment of structural changes in organ (Scalco et al.) 3. valuable biomarker in localized cancer (Yip et al.) 4. absolute gel dosimetry using electron microscopy image (Shih et al.)
Automated radiation targeting (cont.) • A co-registered multimodality pattern analysis segmentation system (COMPASS) was developed. - to automatically delineate the target using PET and CT • PET/CT images of a group of 10 patients • Validated against manual segmentation of 3 radiation oncologist using the volume, sensitivity, and specificity. • Compared with 3 PET-based threshold methods. - SUV of 2.5 - 50% maximal intensity - signal/background ratio
Automated radiation targeting (cont.) • The tumor delineations of the COMPASS were more similar to those of the radiation oncologists. - specificity was 95% ± 2%, and sensitivity was 90% ± 12%. Primary tumor Lymph node Normal tissue CT CT + PET COMPASS (yellow) SUV2.5 (light blue) 50% MAX (white) SBR (dark blue) Oncologists (red)
Automated radiation targeting (cont.) • Automated segmentation using texture analysis of PET/CT images has potential to provide accurate delineation of HNC. • This could lead to reduced interobserver variability, reduced uncertainty in target delineation of HNC. - improve treatment planning accuracy
Assessment of structural changes (cont.) • To characterize structural variations in normal parotid glands during the course of tx. • 21 patients treated w/ IMRT for NPx tumors w/o involvement of parotid glands • CT images were acquired on the first, second and last week using same image protocol (CT1, CT2, CTlast)
Assessment of structural changes (cont.) • Textural indices 1. First-order : mean gray value (μ), variance (σ2), entropy (S1) 2. Second-order : homogeneity (H), local entropy (S2) 3. volume (V), fractal dimension (FD) - calculated as the median value b/w all slices • Evaluations for index or combination of indices 1. sensitivity (Se, probability of positive result given that parotid shrank) 2. specificity (Sp, probability of negative result given that parotid did not shrank) 3. accuracy (Acc, percentage of correct classifications)
Assessment of structural changes (cont.) • S1and H didn’t vary significantly during RT (less sensitive) • μ, S2, FD and V: significant decrease • σ2: significant increase • For multi-parametric analysis, best results were achieved by the combination of FD and V. multi-parametric analysis
Assessment of structural changes (cont.) • Combining volume with other textural parameter - could provide more information than a single-parameter for characterizing tissue structure and deformation of parotids • Correlations b/w textural features and clinical outcome need further investigation • This study could be extended by including other organ at risk (salivary glands or structures related to swallowing)
Biomarker in localized cancer (Cont.) • No established imaging or histological biomarker that identifies responders or good prognosis patients who would benefit from treatment. • CT texture analysis has the potential to be a prognostic biomarker following neoadjuvant therapy in esophageal cancer.
Gel dosimetry (cont.) • The linearity and sensitivity of the texture index vs. dose calibration curves were investigated. • The n-NIPAM gels were irradiated with doses of 5, 10, 15 and 20 Gy. • The gels for freeze drying were cut into 5-mm thin slices for SEM (scanning electronic microscopy) imaging. • The cross-sectional views of the sample surface were acquired at magnifications of 50Ⅹ, 500Ⅹ and 3500Ⅹ.
Gel dosimetry (cont.) • The GLCM method for second-order statistical infromation was applied. • The texture parameter : entropy, contrast, energy and homogeneity. • Dose response parameter - outlier removal e of SEM image for considering noise - offset b/w the two pixels d
Gel dosimetry (cont.) • No regular patterns of roughness were observed as the absorbed dose increased. - after the dose was raised to 15 Gy, the strong polymerization caused the texture to disappear. - SEM image became smoother.
Gel dosimetry (cont.) • Homogeneity is a superior indicator to entropy, contrast and energy. - positive correlation to the absorbed dose.
Gel dosimetry (cont.) • The impurities in the gel resulted in variations of texture analysis. Homgeneity index
Gel dosimetry (cont.) • The mean percentage error was -0.05%. - SEM image is an accurate method for dose readouts of the n-NIPAM polymer gel dosimeter.
What can we do? (Future research) • Using texture analysis, we can 1. distinguish normal and abnormal tissues in the body. 2. characterize tumors as aggressive or non-aggressive. 3. classify different grades of pathologies. 4. to segment different structures of interest.
What can we do? (cont.) • Application to another organ for auto-contouring or structural variation in radiotherpy • Film dosimetry(using EBT2) • Another QA evaluation method (gamma index, MI ) • Anything related to digital images
Conclusion EBT2 CT Texture analysis will be useful tools for radiotherapy. Gel