Texture
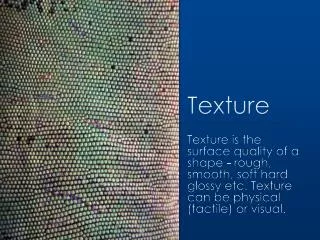
Texture. Texture. Texture is an innate property of all surfaces (clouds, trees, bricks, hair etc…). It refers to visual patterns of homogeneity and does not result from the presence of a single color.

Texture
E N D
Presentation Transcript
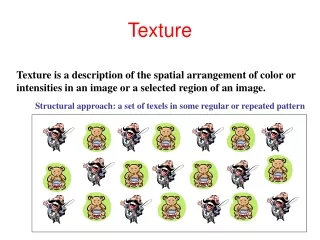
Texture • Texture is an innate property of all surfaces (clouds, trees, bricks, hair etc…). It refers to visual patterns of homogeneity and does not result from the presence of a single color. • Texturednessof a surface depends on the scale at which the surface is observed. Textures at a certain scale are not textures at a coarser scale. Differently from color, texture is a property associated with some pixel neighbourhood, not with a single pixel.
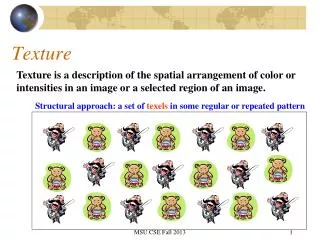
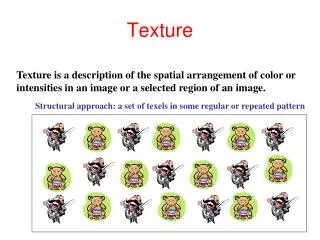
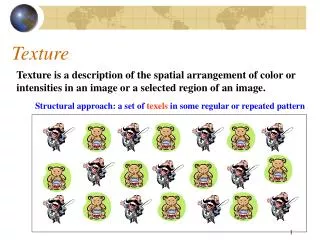
Textures can be detected and described according to spatial, frequency or perceptual properties. The most used approaches are: • Statistics: statistical measures are in relation with aspect properties like contrast, correlation, entropy…. • Stochastic models: stochastic models assume that a texture is the result of a stochastic process that has tunable parameters. Model parameters are therefore the texture descriptors • Structure: structure measures assume that texture is a repetition of some atomic texture element often referred as texel • What approach to follow? • For the purpose of matching any model can be used. • For the purpose of clustering or categorization perceptual features are most significant. Widely accepted classifications of textures are based on psychology studies, that consider how humans perceive and classify textures: f.e. Tamura’s features (coarseness, contrast, directionality, line-likeness, regularity and roughness)
Statistic models: the Co-occurrence matrix • Gray level co-occurrence matrix is a basic measure for statistical model of textures. Given a texture, the image co-occurrence matrix measures the frequency of adjacent pixels. Each element Pd(i,j)in the matrix indicates the relative frequency at which two pixels of grey leveli and j occur at distance d: d=1 Original image Co-occurrence matrix 25
One problem with deriving texture measures from co-occurrence matrices is how to choose the displacement vector d. Occasionally the co-occurrence matrix can becomputed from several values of dand the one which maximizes a statistical measure computed from is used. • Zuckerand Terzopoulos used a χ2measure to select the values of dthat have the most structure, i.e. that maximize the value:
Numeric Features of co-occurrence matrix • Gray level co-occurrence matrices capture properties of a texture but they are not directly useful for further analysis, such as the comparison of two textures. • Numeric features are computed from the co-occurrence matrix that can be used to represent the texture more compactly. Statistics of co-occurrence probabilities can be computed and used to characterize properties of a textured region. Among them the most important are: • Entropy • Contrast • Homogeneity • Algorithms for texture analysis are applied to an image in a series of windows of size w, each centered on a pixel (i,j). The value of the resulting statistical measure are assigned to the position (i,j) in the new pixel.
Entropy • Entropyis a measure of information content. It measures the randomness of intensity distribution. • Entropy is highest when all entries in P[i,j] are of similar magnitude, and small when the entries in P[i,j] are unequal. Entropy with w=21, and d=(2,2)
Contrast k = 2 n= 1 typically • Contrast is a measure of the local variations present in an image. • If there is a large amount of variation in an image the P[i,j] ’s will be concentrated away from the main diagonal and contrast will be high. Contrast with w=21, and d=(2,2)
Homogeneity • A homogeneous image will result in a co-occurrence matrix with a combination of high and low P[i,j] ’s. • Where the range of gray levels is small the P[i,j] will tend to be clustered around the main diagonal. A heterogeneous image will result in an even spread of P[i,j] ’s. Homogeneity with w=21, and d=(2,2)
Correlation • Correlation is a measure of image linearity • Correlation will be high if an image contains a considerable amount of linear structure.
Global image texturemeasures Contrast 2+4+2 = 8 Homogeneity 2+2/2+1/3+4+5+2/2+4 = 17,3
Frequency-based models: wavelet transform • The wavelet transform divides up data into different frequency components and then studies each component with a resolution matched to its scale. Coefficients of the wavelet transform can be used to represent frequency properties of a texture pattern. Gabor wavelet decomposition has been used in MPEG7
Perceptual models: Tamura’s features • Tamura’s features are based on psychophysical studies of the characterizing elements that are perceived in textures by humans : • Contrast • Directionality • Coarseness • Linelikeness • Regularity • Roughness
Contrast • Contrastmeasuresthe way in whichgraylevelsqvary in the image I and to whatextenttheirdistributionisbiased to black or white. where: n = 0.25recommended variance kurtosis(accountsfor the shapeof the distribution, i.e. the degreeofflatness)
Directionality x y • Directionality takes into account the edge strenghtand the directional angle. They are computed using pixelwise derivatives according to Prewitt’s edge detector x, y are the pixel differences in the x and y directions • A histogramHdir(a) ofquantised direction valuesisconstructedbycountingnumbersof the edgepixelswith the correspondingdirectionalangles and the edgestrengthgreaterthan a predefinedthreshold. The histogramisrelativelyuniformforimageswithout strong orientation and exhibitspeaksforhighlydirectionalimages.
Coarseness • Coarsenessrelatesto distances of notablespatialvariations of greylevels, thatis, implicitly, to the sizeof the primitive elements (texels) forming the texture. Measures the scale of a texture. For a fixedwindowsize a texture with a smallernumber of textureelementsissaid more coarsethanonewith a largernumber. • A methodtoevaluate the coarsenessof a textureis the following: • At each pixel p(x,y) compute sixaveragesAkfor the windows of size2kk = 0,1,2,..5 coarseness ….. 20 21 22 23
At scale 1 E1,a (p)= | A11 – A12 | 21 • At each pixel • compute the absolutedifferences at each scale Ek (x,y) betweenpairsofnonoverlappingaverages on oppositesidesofdifferentdirections Ek,a (p)= | Ak1 – Ak2 | Ek,b(p) = | Ak3 – Ak4 | p(x,y) = E1,a , E1,b , E2,a , E2,b….. • Find the valueofkthatmaximizesEk (x,y) in either direction. • Select the scale with the largestvariation: Ek= max (E1 , E2 , E3 , ..). The best pixel windowsizeS best is2k • ComputecoarsenessbyaveragingSbestover the entireimage 3 2 2 1 1 4 • Texturesof multiple coarsenesshave a histogramof thedistributionof the Sbest
Linelikeness • Linelikenessisdefinedas the averagecoincidence of edgedirectionsthat co-occur at pixelsseparated by a distancedalong the directiona. itisrelatedto Correlation Angle = a Distance =d
Derivedmeasures • Regularity: isdefinedas: 1 – r(scoarseness + scontrast+ sdirectionality + slinelikeness ) beingr a normalisingfactor andsthe standard deviation of the feature in eachsubimage of the texture • Roughness:isdefinedas: Coarseness + Contrast