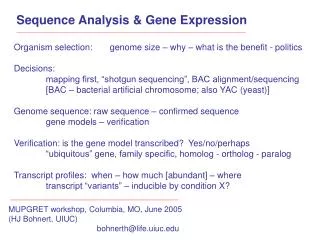
Sequence Analysis & Gene Expression
This text explores the significance of genome sequencing and gene expression analysis in organisms, particularly focusing on Arabidopsis thaliana. It discusses various methodologies such as shotgun sequencing, BAC alignment, and transcript profiling to unveil gene models and their functions. Additionally, it highlights the complexities of gene regulation, the role of microRNAs, and implications for plant biology research. Furthermore, it emphasizes the importance of database integration and innovative experimental techniques in advancing our understanding of plant genomes and transcriptomes.

Sequence Analysis & Gene Expression
E N D
Presentation Transcript
Sequence Analysis & Gene Expression Organism selection: genome size – why – what is the benefit - politics Decisions: mapping first, “shotgun sequencing”, BAC alignment/sequencing [BAC – bacterial artificial chromosome; also YAC (yeast)] Genome sequence: raw sequence – confirmed sequence gene models – verification Verification: is the gene model transcribed? Yes/no/perhaps “ubiquitous” gene, family specific, homolog - ortholog - paralog Transcript profiles: when – how much [abundant] – where transcript “variants” – inducible by condition X? MUPGRET workshop, Columbia, MO, June 2005 (HJ Bohnert, UIUC) bohnerth@life.uiuc.edu
B Y X A TP Mal Genomics … not just genes genome & transcriptome sequences protein interaction maps markers & QTLs ATCCGAAGCG CTTGGAAAA biochemical genetics expression profiles Databases, Integration & Intuition knock-out sRNA & RNAi dynamic metabolite catalogs protein localization structure analysis How (much) will ‘encyclopedic’ approaches lead to better understanding? information mining, hypotheses, experiment - insight, application, virtual life
O3 CO2 control Columbia grown in Soy-FACE Arabidopsis – model plant small, fast, prolific, mutants, lines, ecotypes, genome sequence Field on a dish!
10 20 30 5 Mb PIP1;3 TIP3;2 TIP2;xpseudo TIP3;1 NIP6;1 NIP3;1 Ch-1 (15) PIP2;8 NIP3;1pseudo TIP4;1 NIP2;1pseudo NIP2;1 PIP2;6 PIP1;2 Ch-2 (4) rDNA TIP1;1 PIP2;2 PIP2;3 SIP1;1 NIP7;1 TIP2;1 TIP1;2 TIP5;1 PIP2;1 SIP2;1 Ch-3 (14) PIP1;1 PIP2;5 PIP1;4 TIP1;3 NIP5;1 TIP2;2 NIP1;1 NIP1;2 PIP1;5 PIP2;7 Ch-4 (3) SIP1;2 NIP4;1 NIP4;2 TIP2;3 PIP2;4 Ch-5 (12) - duplicated regions that include AQPs. AQP are distributed over all Chromosomes - a few clusters, many duplications Arabidopsis thaliana AGI, 2000
Ecosystem – population – species – ecotype (- breeding line) Organism – organ – tissue – cell – compartment Nucleus – envelope & pore – nucleoplasm, nucleolus & chromosomes Euchromatin & heterochromatin – gene islands – gene Promoters – 5’-regulatory (untranslated = UTR) – introns & exons – mature coding region – 3’-regulatory (UTR) regions The Plant Genome Plants in silico? Sure! And then: Plant Design from Scratch
Controls for Gene Expression – many Switchboards The Plant Genome • Chromatin condensation state • Local chromatin environment • Transcription initiation • Transcript elongation • mRNA splicing • mRNA export • mRNA place in the cell • RNA half-life • Killer microRNAs • Ribosome loading • Protein transport/targeting • Protein modifications • Protein turnover Levels of regulation that affect what we call “gene expression”
Result: no protein - i.e., gene is essentially “silenced” The Plant Transcriptome 5 years ago, we did not know that such a control system existed! Killer RNAs (there are micro-genes) microRNAs
The Plant Transcriptome How to sample the transcriptome? • Morphological dissection • (root, leaf, flower - epidermis, guard cell, etc.) • Cell sorting • make single cells, send through cell sorter • (size, color, reporter gene) • Laser ablation • micromanipulation of laser to cut • individual cells • Biochemical dissection (compartment isolation) • chloroplasts, mitochondria, • ribosomes, other membranes Painting cells with a reporter gene - here is GFP Green Fluorescence Protein
The Plant Transcriptome Painting tissues then isolating desired cells Enzymatic staining The Endodermis of the root tip is highlighted in transgenic plants using pSCR::mGFP5. Emerging lateral roots [requires plant transformation]
The Plant Transcriptome cDNA – complementary DNA converts messenger RNA into double-stranded DNA • > cDNA libraries • “neat” • normalized • subtracted • > SAGE libraries “Normalization” removes mRNAs for which there are many copies in a cell – thus enriching for “rare mRNAs” (not so much sequencing to do) Subtraction removes cDNAs which you already know (less sequencing)
Primary cDNA Library Library Normalization Total RNA primary cDNA library make ss-DNA out of primary library Poly(A)+ RNA 1st strand cDNA PCR inserts by T7 and T3 standard primers ss-DNA ds-cDNA DNA “tracer” Size-selected double stranded cDNA (>500 bp) DNA “driver” tracer/driver hybridization Ligate to EcoRI adapters/digest NotI column chromatogr. (double-strands stick) Clone (EcoRI/NotI) digested pBSII/SK+ & adaptored cDNA Primary (neat) library may be used for “normalization” Non-hybridized DNA from flow-through = normalized clones The Plant Transcriptome cDNA Libraries Cloning of root RNAs from segments S1 – S4 root tip (Sharp lab) sequenced ~18,000 clones found ~8,000 unique and ~130 novel genes How many genes make a root?
Serial Analysis Gene Expression Velculescu et al. 1995 http://www.sagenet.org/
coding region (known or expected) forward p. reverse p. Amplicon (sequence or clone + sequence) 1 2 3 4 5 6 7 8 9 10 M results
Real-time PCR) (quantitative) RNA (DNA-free) to cDNA use product in dilutions for amplification Assumption each cycle increases amount by factor 2 (or 1.8) Check by using known amount of cloned control cDNA [cycle number] Serial dilution 1x - 1/5x - 1/25x - 1/125x
Melting curves [single products] Single genes have been amplified here Two amplicons are shown Each shows a single melting curve
Melting curves [multiple products] More than one gene has been amplified here Homologous genes [identity – similarity – divergence] orthologous – paralogous relationships
The Plant Transcriptome Quantitative PCR in 384-well plates (96 primer pairs, 3 repeats each) Taking SAGE & cDNA sequences together - corn roots “express” 20-23,000 genes (i.e., mRNA is made) - The entire corn genome is expected to include ~50,000 genes
Nylon Membrane Glass Slides GeneChip Substrates for High Throughput Arrays Single label 33P Single label biotin streptavidin Dual label Cy3, Cy5
Pin pick-up volume 100-250 nl Spot diameter 75-200 um Spot volume 0.2-1.0 nl TeleChem ChipMaker2 Pins
Creating cDNA Arrays Q-Pix cDNA cloned into vector and transformed to create cDNA library Clones sequenced and unique set chosen and reracked Unique set of clones 384 well microtiter plate PCR on Tecan workstation Slides printed on Cartesian Arrayer Final product
NSF Soybean Functional Genomics Steve Clough / Vodkin Lab Printing Arrays on 50 slides
O O O O O O O O O O O O O O O O O O O O O O O Si Si Si Si Si Si Si Si Si Si Si Aldehyde Silylated NSF Soybean Functional Genomics Steve Clough / Vodkin Lab Slide Chemistry Glass Coatings Amine Poly-L-lysine Silanated We use SuperAmine and SuperAldehyde from TeleChem (arrayit.com)
NSF Soybean Functional Genomics Steve Clough / Vodkin Lab GSI Lumonics
GenePix Image Analysis Software Placenta vs. Brain – 3800 Cattle Placenta Array cy3cy5
Troubleshooting NSF Soybean Functional Genomics Steve Clough / Vodkin Lab The Good The Ugly The Bad
Post-Print Processing Hot Printed slide Snap dry W ater Rehydrate spots UV light Chemically block background. Denature to single strands. Hybridize & Scan Fix DNA to coating
Cells from condition A Cells from condition B mRNA Label Dye 1 Label Dye 2 cDNA Mix equal over under Ratio of expression of genes from two sources
Overlay Images Reverse Labeling Slide 1 Cy3 over-expressed Slide 2 Cy5 over-expressed
Universal vs. Universal (control v. control) Problem area at low intensity readings
Lung vs Control
Clustered display of data from time course of serum stimulation of primary human fibroblasts. Cholesterol Biosynthesis Cell Cycle Immediate Early Response Signaling and Angiogenesis Wound Healing and Tissue Remodeling Eisen et al. Proc. Natl. Acad. Sci. USA 95 (1998) pg 14865
Hierarchical Clustering: 14 Tissues 7653 Genes
Differences in Technology Affymetrix One sample, one chip Single Color Scans Labeling by incorporating Biotin into cRNA not Cy3 or Cy5 dyes Oligonucleotides instead of full-length cDNAs Higher Density Arrays Feature sizes down to 18 mm instead of ~100 mm Non-contact Creation of Arrays GeneChips
Affy Technology Overview • Photolithography and combinatorial chemistry • Technology from microchip industry: “GeneChip” • Coat slides • “Mask” to apply light to only desired features, de-protects feature
Technology Overview (cont.) • Apply required nucleotide base to array • Apply new mask to de-protect different features • Stack nucleotides on top of one another • Repeat with bases and masks until 25-mer oligonucleotides are built directly onto array
Technology Final Steps • Silicon “wafers” of 90 arrays are cut • Glass substrate is then added to plastic cartridge for: • Safe handling • Easy storage • Easy hybridization • Easy scanning Easy, convenient Expensive (very much so) No confirmation of quality Erroneous data when low intensity Problems with SNPs* *not with 70-mer oligo glass slides
Questions? Give me a call or send a message 217-265-5475 bohnerth@life.uiuc.edu http://www.life.uiuc.edu/bohnert/ Remember: YOU CAN ALWAYS FIND EVERYTHING ON GOOGLE! (though not these slides)


![[VI]. Post-Transcriptional Processing and Post-Transcriptional Control of Gene Expression](https://cdn1.slideserve.com/3214110/vi-post-transcriptional-processing-and-post-transcriptional-control-of-gene-expression-dt.jpg)


![[III] Genes, Genomics, and Chromosomes](https://cdn1.slideserve.com/3548265/iii-genes-genomics-and-chromosomes-dt.jpg)