Putting the LBRS and other GIS data to Work for Traffic Flow Modeling in Erie County
Putting the LBRS and other GIS data to Work for Traffic Flow Modeling in Erie County. Sam Granato, Ohio DOT Carrie Whitaker, Erie County. 2015 Ohio GIS Conference. September 21 - 23, 2015 | Hyatt Regency Columbus| Columbus, Ohio. What Is A Metropolitan Planning Organization?.

Putting the LBRS and other GIS data to Work for Traffic Flow Modeling in Erie County
E N D
Presentation Transcript
Putting the LBRS and other GIS data to Work for Traffic Flow Modeling in Erie County Sam Granato, Ohio DOT Carrie Whitaker, Erie County 2015 Ohio GIS Conference September 21 - 23, 2015 | Hyatt Regency Columbus| Columbus, Ohio
What Is A Metropolitan Planning Organization? • The MPO is a transportation policy-making organization made up of representatives from local government and transportation authorities. The Federal Surface Transportation Assistance Act of 1973 requires the formation of an MPO for any urbanized area with a population greater than 50,000. • Erie County was designated as an MPO in 2003 as a result of the 2000 US Census (pop 50,693) • Includes all of Erie Co. and the Lorain Co. portion of the City of Vermilion
What Is A MetropolitanPlanning Organization? • MPO oversees federal highway dollars (STP, TA) by making decisions regarding project funding for the region. • MPO is also charged with short and long range transportation planning for the MPO planning area. • The Long Range Transportation Plan (LRTP) is a required document for all MPO’s. • Plan must cover 20 year timeframe • Updated every 5 years (Approved July 2015) • Plan emphasizes mobility and access for people and goods, efficient system, performance/preservation, and quality of life 2040 LRTP
The LRTP Planning Process • Includes the following steps: • The forecasting of future population, traffic, and employment growth; • Assessing projected land uses in the area; • Identifying major growth corridors • Traffic modeling assists us with completing these tasks and used to evaluate and develop alternative capital and operating strategies for movement of people/goods
The rationale for a formal traffic forecasting process, and why the one for Erie RPC is unique: • Trendlines? – not usable for new route locations, sometimes not sufficient for significant improvements (including crossing or parallel travel routes) or when nearby land use changes. • Seasonal traffic – unlike most of the rest of the state, the local economy is driven considerably by summer recreation, but the impact varies by location within Eric county. So separate models created by season (and weekday vs weekend in summertime). • Other unique features of travel demand modeling – dynamic travel routing (for duration as well as extent of congestion), including use of travel time variability as well as average values.
The (iterative) model process: • 1) Select subset of digital road and traffic control shape files (LBRS) and create a routable network • 2) Divide area into zones based on access to the selected network, and geocode land use data to these zones • 3) Develop trip generation by zone and trip purpose/vehicle type • 4) Allocate daily trip totals by purpose and direction into 15-60 minute time intervals • 5) Develop trip-length distributions and select destinations for all trips by purpose • 6) Assign traffic to network by 15-60 minute time period (iterative w/#5)
Roadway centerline files, old and new: (improved spatial accuracy for both visualization and improve integration with other data sources)
Source material: (roadway network) • LBRS (digital e-911) centerline and supplemental files • ODOT Road Inventory/OSIP aerials/pictometry • State & local traffic counts and travel speed/time data • Highway capacity/level of service relationships
Shape files available thru the LBRS program(For traffic modeling, most of the LBRS file’s value is in the location, topology, connectivity and visualization - most data is overlayed from other sources.)
Use of RR crossing file with train data and queuing delay estimates allows analysis of traffic re-routing • (Use of stop/yield (small dots) and local speed limit sign inventories also eliminates need for “rule-based” systems
Source material, cont. (land use and demand) • Census data for population characteristics • Various employment/worker/school data files • ITE & related Trip Generation manuals • NCHRP research reports for guidance on segmenting demand by trip purpose, vehicle type, and time of day
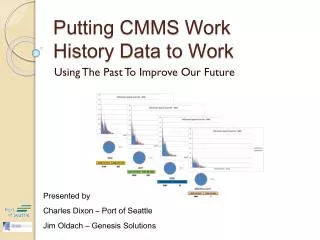
Base year results (travel times) • Varies by level of aggregation, but data sources verify that modeled travel times are generally correct (especially important for arterial congestion analysis)
Forecasting future land use: overall levels • ODOD forecasts of population by 5-year age and sex cohorts (combined with historical trends to forecast persons and vehicles per housing unit, along with schoolkids and resident workforce via workforce participation rates by age and sex) • ISAM-based growth rates of employment by industrial category (used in statewide model, with trendlines adjusted for recent local declines in auto industry and ODOD’s forecasted decline in schoolage children to provide “reasonable” match to population trends)
Forecasting future land use: by location • Local development plans on file • Land Use categories for vacant land (by parcel)
Formulas for distribution of acreage for new land development – by land use type
Forecasting future volumes and delays: • Many different ways to analyze and present the forecasts (and trade-offs) – impact over a full day, duration vs peak intensity of congestion, other . . .
Alternate measure – average or change in delay over a full day instead of peak LOS
Questions? • Sam.Granato@dot.ohio.gov • CWhitaker@eriecounty.oh.gov