Download
1 / 56
560 likes | 616 Vues
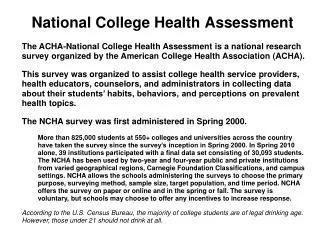
The National College Health Assessment (NCHA) survey conducted at the University of Michigan in February 2014 provides insights into the health behaviors and attitudes of college students. The survey covers areas such as perceived health status, impediments to academic performance, protective health behaviors, immunization perception of safety, abuse and violence, and substance use.

E N D
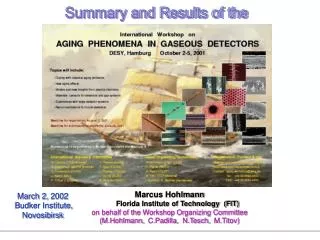
Summary of Results of theNational College Health Assessment University of Michigan, Ann Arbor Campus February, 2014
What is the NCHA Survey • Designed by the American College Health Association (ACHA) to align with Healthy Campus goals • Measures prevalence of health risk and protective behavior among college students • UM previously conducted it in 1998 (pilot), 2006 (NCHA I) and 2010 (NCHA II: revised questionnaire)– Undergraduates only • National data compiled by ACHA (comparability issues: sampling, college types, seasonal variations, weighting)
How Can the Data be Used? • To provide a “snapshot” in time of the behaviors, attitudes and beliefs of students with regard to health • To compare with findings from other surveys and (especially) prior years at UM • To develop goals to improve health outcomes and assess progress, evaluate impact
Methodology • Conducted in February 2014 (same as in 2010) • Random sample of 7,000 undergraduates and 5,000 graduate/professional students • Males and undergrad minority students over-sampled because of lower response rates (as in 2010) • Email invitation with two reminder emails • Incentives offered for participation
Response Rate & Analysis • 3,351 respondents (59 excluded as too incomplete) • Working data file: 3,292 (1,561 undergrads, 1,731 grad/prof) • Response rate: 28% overall, 22% among undergrads, 35% among grad/prof • Margin of sampling error: + 1.8% overall, + 2.9% undergrads, + 2.2% grad/prof • Data weighted by gender, race, student status, and citizenship to match UM Winter 2014 enrollment • Analyses conducted on the weighted data
Perceived Health Status 2010: 93% of Undergrads rated their health as good, very good or excellent vs. 92% in 2014 Males, white (non-Hisp), those with higher GPA rated health better
Top Reported Impediments to Academic Performance Undergraduates (UG) Grad/Professional (G/P) Stress (18%) Anxiety (14%) Sleep difficulties (11%) Depression (10%) Internet/games (8%) Work (8%) Cold/flu/sore throat (7%) Concern for troubled friend (7%) Relationship difficulty (6%) Extra-curricular activities (5%) [vs. 2010] • Stress (31%) [25%] • Anxiety (22%) [17%] • Sleep difficulties (20%) [19%] • Extra-curricular activities (16%) [13%] • Cold/flu/sore throat (15%) [18%] • Depression (15%) [10%] • Internet/games (15%) [14%] • Work (12%) • Relationship difficulty (9%) • Concern for troubled friend (8%)
Protective Health Behaviors Past 30-day behaviors: • 33% of G/P, 26% of UG [vs. 31% in 2010] females reported Breast Self Exam • 29% of G/P, 33% of UG [vs. 31% in 2010] male respondents reported Testicular Self Exam; • Whites, those with lower GPAs more likely to perform TSE Past 12-month behaviors: • 62% of G/P, 44% of UG [vs. 48% in 2010] females reported a routine gynecological exam; • Whites, more likely to have had a gynecological exam • 70% of G/P, 83% of UG [vs. 84% in 2010] reported a dental exam/cleaning
Protective Health Behaviors • 59% of G/P, 54% of UG [vs. 46% in 2010] reported using sunscreen regularly • More likely among those with higher grades, female • 91% of G/P, 81% of UG [81% in 2010] report “always” using a seatbelt • 57% of G/P, 28% [30% in 2010] of UG bike riders wear a helmet “most of the time” or “always” • Healthy Campus 2020 goal is 37.7% • 86% of G/P, 78% of UG motorcycle riders wear a helmet “most of the time” or “always” • Healthy Campus 2020 goal is 94.4%
Perception of Safety Percent of respondents who feel “very safe:” • 92% of G/P; 93% of UG on-campus during the day • [vs.92% in 2010] • 34% of G/P; 40% of UG on-campus at night • [vs. 32% in 2010] • 2020 Healthy Campus goal is 35.1% • 69% of G/P; 75% of UG in Ann Arbor during the day • [vs. 66% in 2010] • 21% of G/P; 28% of UG in Ann Arbor at night • [vs. 20% in 2010]
Non-Physical Victimization 17% of UG, 11% of G/P respondents reported non-physical victimization (being verbally threatened or stalked) in the last 12 months [vs. 22% in 2010] Victimization more likely among • Those with lower GPA • Those in a fraternity/sorority • Males than females • Those who used alcohol during the previous 30 days
Past 30-Day Substance Use • Alcohol use more likely among: • “A or B” students, grad students, white, females, domestic students, live in fraternity/sorority house or off campus • Cigarette use more likely among: • Undergrads, White, lower grades, live in fraternity/sorority house or off campus • Marijuana use more likely among: • Undergrads, males, lower grades, live in fraternity/sorority house or off campus
Blood Alcohol Content (Last Time Partied/Socialized, Drinkers Only)
Use of Protective Strategies** ** Report doing ‘always’, ‘most of the time’, or ‘sometimes’
Prevalence of at Least One Undesirable Consequence of Drinking by Number of Drinks at Last Time Partied
Binge Drinking in Last 2 Weeks • Number of sexual partners • Number of types of physical victimization • Prescription drug misuse Positively correlated with:
Undesirable Consequences of Drinking: Undergrads, Fraternity/Sorority Members vs. Non-Members
Use of Protective Strategies:**Undergrads, Fraternity/Sorority Members vs. Non-Members ** Report doing ‘always’, ‘most of the time’, or ‘sometimes’
Prescription Drug Misuse Positively correlated with: • Increased BAC at last time partied or socialized • Difficulty getting to sleep • Number of emotional problems • Number of health problems • Number adverse outcomes from drinking • Sexually abusive relationships • Physical victimization • Non-physical victimization • Number of sexual partners
Condom / Barrier Use at Last Intercourseif reporting past 30-day activity
Number of Sexual Partners 73% of undergraduates [vs. 75% in 2010] reported 0 or 1 sexual partners in the past year
HIV Testing • 34% of Grad/Professional students, 15% of undergrads [vs. 12% in 2010] reported ever being tested for HIV • Among undergrads, prevalence of ever being tested greater among • Females • 20+ year olds • Those with lower GPAs • More sexually active • Sexual minorities • More frequent users of illegal drugs • Those living in fraternity/sorority house or off campus
Contraception, Emergency Contraception (used by self or partner), and Unintentional Pregnancy • 0.5% Undergrad [1% in 2010], 0.5% Grad females reported unintentional pregnancy -- 2020 Healthy Campus Goal is 1.4%
Physical Activity • 43% of G/P, 46% of UG respondents [vs. 48% in 2010] met physical activity goals • More likely if white • Vigorous physical activity (3+ days per week) more likely among: • White respondents, higher GPA • Strength-training exercises (2+ days per week) more likely among: • Respondents with higher grades, males, Live off campus
Fruits and Vegetables • 9% of G/P, 6% of UG [vs. 7% in 2010] reported eating 5 or more servings per day • Healthy Campus 2020 goal is 6.6% • 53% of G/P, 63% of UG [vs. 62% in 2010] reported eating 2 or fewer servings per day • More likely if lower grades, younger, male, international or non-white
Body Mass Index • The prevalence of being overweight or obese was greater among those who are: • Male, have lower GPA’s, live off-campus, older, upper classmen or G/P students, domestic students • Those who were overweight or obese were more likely to report: • Lower general health • Exercising, dieting to lose weight in the last 30 days
Perceptions of Weight • 14% of G/P students, 10% of UG [vs. 15% in 2010]not overweight describe themselves as slightly overweight or very overweight • 23% of G/P students, 23% of UG [vs. 19% in 2010, 24% in 2006] overweight or obese describe themselves as about the right weight or underweight
Mental Health Diagnosis or Treatment in Past 12 Months • 18% of G/P, 15% of UG [vs. 16% in 2010] report lifetime diagnosis of depression
Emotional Disturbances • Healthy Campus 2020 goal for attempted suicide is < 1.2%
Emotionally Disturbing Events More likely to be reported by: • Females vs. males • Undergrads vs. grad/professional • Domestic (especially minorities) vs. international • LGB vs. heterosexuals • Alcohol users vs. non-drinkers • Those who experienced 1+ harmful consequence of drinking in past year • Those who misused 1+ prescription drugs in past year • Those who got fewer days of restful sleep per week • Those who exercised fewer days per week
Stress • 7% of G/P, 9% of UG [vs. 9% in 2010] reported less than average or no stress • 33% of G/P, 36% of UG [vs. 42% in 2010] reported average stress • 58% of G/P, 57% of UG [vs. 49% in 2010] reported more than average or tremendous stress • Greater stress more likely to be reported by: • Females , domestic students, those with lower GPA’s, upper classmen • Higher stress levels are significantly correlated with: • Increased emotional disturbances, victimization, and more traumatic/very difficult problems encountered
Lifetime Use of Mental Health Services • A Counselor/Psychologist: • 38% of G/P, 32% of UG [vs. 27% in 2010] • A Psychiatrist • 15% of G/P, 12% of UG [vs. 10% in 2010] • Other Medical Provider • 12% of G/P, 12% of UG [vs. 8% in 2010] • Member of Clergy • 7% of G/P, 4% of UG [vs. 4% in 2010] • UM Counseling or Health Center • 19% of G/P, 18% of UG [vs. 14% in 2010]
Sleep Quality • 33% of G/P, 37% of UG did not sleep enough to feel rested on 5 or more days/week [vs. 75% in 2010*] • 11% of G/P, 20% of UG [vs. 19% in 2010] reported that sleep difficulties affected their academic performance • Poor sleep quality more common among: • Females, younger students, those with lower GPA, minorities/internationals • Poor sleep quality correlated with: • Increased instances of emotional disturbance • Victimization • Higher BAC at last time “partied or socialized” • Fewer days of vigorous exercise in the past week • Increased stress levels * Possible discrepancy in coding