Download
1 / 56
560 likes | 725 Vues
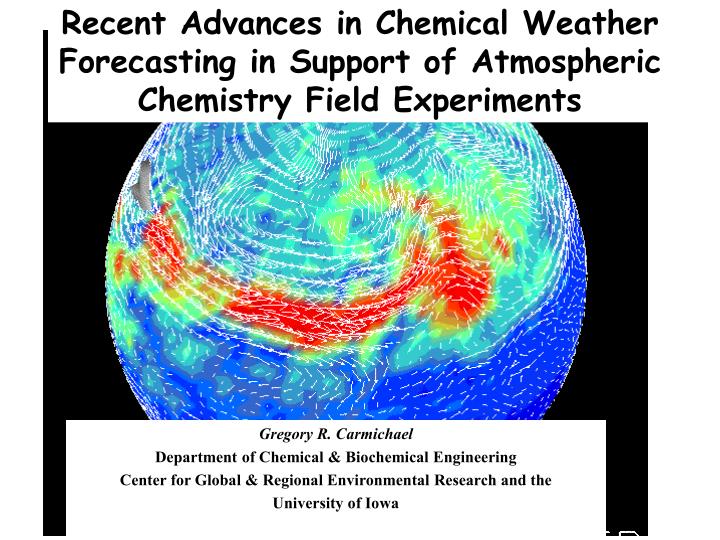
Recent Advances in Chemical Weather Forecasting in Support of Atmospheric Chemistry Field Experiments. Gregory R. Carmichael Department of Chemical & Biochemical Engineering Center for Global & Regional Environmental Research and the University of Iowa. TRACE-P and ACE-Asia EXPERIMENTS.

E N D
Recent Advances in Chemical Weather Forecasting in Support of Atmospheric Chemistry Field Experiments Gregory R. Carmichael Department of Chemical & Biochemical Engineering Center for Global & Regional Environmental Research and the University of Iowa
TRACE-P and ACE-Asia EXPERIMENTS Satellite data in near-real time: MOPITT TOMS SEAWIFS AVHRR Stratospheric intrusions FLIGHT PLANNING Long-range transport from Europe, N. America, Africa C-130 3D chemical model forecasts: - ECHAM - GEOS-CHEM - Iowa/Kyushu - Meso-NH ASIAN OUTFLOW Boundary layer chemical/aerosol processing DC-8 P-3 PACIFIC • Emissions • Fossil fuel • Biomass burning • Biosphere, dust ASIA PACIFIC
Models are an Integral Part of Field Experiments • Flight planning • Provide 4-Dimensional context of the observations • Facilitate the integration of the different measurement platforms • Evaluate processes (e.g., role of biomass burning, heterogeneous chemistry….) • Evaluate emission estimates (bottom-up as well as top-down)
Model OverviewRegional Transport Model: STEM • Structure: Modular (on-line and off-line mode) • Meteorology: RAMS - MM5 - ECMWF - NCEP • Emissions: Anthropogenic, biogenic and natural • Chemical mechanism: SAPRC’99 (Carter,2000) • 93 Species, 225 reactions, explicit VOC treatment • Photolysis: NCAR-TUV 4.1 (30 reactions) • Resolution: Flexible 80km x 80km for regional and 16km x 16km for urban
Photochemistry: STEM-TUV Y. Tang (CGRER), 2002
CFORS/STEM Model Data Flow Chart Meteorological Outputs from RAMS or MM5 Meteorological Preprocessor Normal meteorological variables: wind velocities, temperature, pressure, water vapor content, cloud water content, rain water content and PV et al Dust and Sea Salt emissions Biomass Emissions Biogenic Emissions CFORS Forecast Model with on-line TUV Emission Preprocessor Post Analysis Large Point Sources Volcanic SO2 Emissions Anthropogenic Area Emissions Satellite Observed total O3 (Dobson Unit)
CFORS/STEM Model Data Flow Chart Meteorological Outputs from RAMS or MM5 Meteorological Preprocessor Normal meteorological variables: wind velocities, temperature, pressure, water vapor content, cloud water content, rain water content and PV et al Dust and Sea Salt emissions Biomass Emissions Biogenic Emissions Tracers/Markers: SO2/Sulfate DMS BC OC Volcanic Megacities CO fossil CO-Biomass Ethane Ethene Sea Salt Radon Lightning NOx Dust 12 size bins CFORS Forecast Model with on-line TUV Emission Preprocessor Post Analysis Large Point Sources Volcanic SO2 Emissions Anthropogenic Area Emissions Satellite Observed total O3 (Dobson Unit)
Regional Emission Estimates:Anthropogenic Sources Industrial and Power Sector Coal, Fuel Oil, NG SO2, NOx, VOC, and Toxics Domestic Sector Coal, Biofuels, NG/LPG SO2, CO, and VOC Transportation Sector Gasoline, Diesel, CNG/LPG NOx, and VOC
Regional Emission Estimates:Natural Sources Biomass Burning In-field and Out-field combustion CO, NOx, VOC, and SPM Volcanoes SO2, and SPM Dust Outbreaks SPM
Regional Emission Estimates:Sectoral Contributions Annual Asian Emissions for Year 2000 PP = Power Sector BB = Biomass Burning IND = Industries TRAN = transport DOM = Domestic SO2 = 34.8 Tg NOx = 25.6 Tg CO = 244.8 Tg VOC = 52.7 Tg SO2 NOx CO VOC
Regional Emission Estimates:% by Economic Sector : SO2 Emissions Domestic Industrial Transport Power
Regional Emission Estimates:% by Economic Sector : NOx Emissions Domestic Industrial Transport Power
For Southeast Asia and Indian Sub-Continent Original Fire Count(FC) data(AVHRR) 5-day Fire Count Moving Averaged Fire Count data (Level 2) “Fill-up” Zero Fire Counts using Moving Average(MA) Satellite Coverage Cloudiness Precipitation(NCEP) “Fill-up” Zero Fire Count using TOMS AI Mask Grid (Landcover) Mask Grid (Never Fire) “Extinguish” Fire Count using Mask Grids AI Adjusted Fire Count data (Level 3) Regress. Coeff.(AI/FC) Regional Emission Estimates:Biomass Burning Emissions
Open Burning Emissions of CO – Based on AVHRR Fire-count Data
The Importance of Fossil, Biofuels and Open Burning Varies by Region
Uncertainty analysis has revealed wide differencesin our knowledge of the emissions of particularspecies in particular parts of Asia …
Frontal outflow of biomass burning plumes E of Hong Kong Biomass burning CO forecast (G.R. Carmichael, U. Iowa) Observed CO (G.W. Sachse, NASA/LaRC) Observed aerosol potassium (R. Weber, Georgia Tech)
Using Measurements and Model – We Estimate Contributions of Fossil, Biofuel and Open Burning Sources
Contribution of Asian Fuel Burning to Tropospheric Ozone Yienger, et al, JGR 2000
NASA GTE TRACE-P Mar’01-Apr’01 • Two aircrafts – DC8 and P3 • Chemical evolution during continental outflow, biomass burning, dust outbreaks, and urban plumes • 22 flights out of Hong Kong, Okinawa and Tokyo • O3, CO, SOx, NOx, HOx, RH and J • 100m to 12000m China
% Urban Contribution to Regional PhotochemistryMonthly Average March’01 Between 0-500m
Characterization of Urban PollutionFlight DC8-13 : 03/21/2001 Flight Path Back Traj. % Urban HCHO • 1000 ppbv of CO, 10 ppbv of HCHO, 100 ppbv of O3 • Fresh plumes out of Shanghai, < 0.5 day in age
Characterization of Urban PollutionFlight DC8-16 : 03/29/2001 Flight Path Back Traj. % Urban HNO3 • Sunrise experiment 300 ppbv of CO, 60 ppbv of O3 • Pollution entrainment in the high pressure system • Fresh plumes out of Shanghai, aged plumes from Beijing
Characterization of Urban PollutionFlight P3-18 : 03/30/2001 Flight Path Back Traj. Back Traj. • 200-350 ppbv of CO, 60 ppbv of O3, 5-6 ppbv of NOy, 700-1500 pptv of NO and 3 ppbv of C2H6 • Fresh plumes out of Seoul and Pusan in one leg, aged plumes from Beijing and Coastal China in the other
Characterization of Urban PollutionBack Trajectory Analysis Color code indicates plume age in days from that city No. of Points 984 out of 2238
Urban PhotochemistryOH Radical Cycle VOC + OH ---> Orgainic PM PM2.5 SOx [or NOx] + NH3 + OH ---> (NH4)2SO4 [or NH4NO3] Ozone Visibility Fine PM (Nitrate, Sulfate, Organic PM) .OH NOx + VOC + OH + hv ---> O3 Acid Rain Water Quality SO2 + OH ---> H2SO4 NOx + SOx + OH (Lake Acidification, Eutrophication) NO2 + OH ---> HNO3 Air Toxics OH <---> Air Toxics (POPs, Hg(II), etc.)
Urban Photochemistry • Tropospheric chemistry is characterized by reaction cycles • OH plays a key role in tropospheric chemistry • Reactions lead to removal as well as generation of pollutants • NOx to VOC ratio governs Ozone production
Urban PhotochemistryNOx-VOC-Ozone Cycle • Organic radical production and photolysis of NO2 • VOC’s and N-species compete for OH radical
Urban PhotochemistryNOx-VOC-Ozone Cycle • In polluted environment, CO contributes to O3 production
Urban PhotochemistryNOx-VOC-Ozone Cycle • HCHO – primary intermediate in VOC-HOx chemistry • Short lived and indicator of primary VOC emissions
Urban PhotochemistryNOx-VOC Emission Ratio Units: g NO2 to g C In 2000
Urban PhotochemistryNOx-VOC-Ozone Cycle Units: ppbv/hr O3 Cycle STEM Box Model Calculations For City of Seoul, O3 Cycle STEM Box Model Calculations For City of Shanghai
Urban Photochemistry Species to Species Comparison CO Vs VOC: Megacity points from back trajectories • CO produced due to photolysis of HCHO, a short lived intermediate from reactions between VOC and HOx • High O3 and CO concentrations are linked with high VOC concentrations, especially with urban plume age < 1.0 day
Urban Photochemistry HCHO to CO Ratios Age in days calculated from back trajectories along the flight path Units: ppbv-HCHO/ ppbv-CO
Urban Photochemistry Species to Species Comparison O3 Vs Species: Megacity points from back trajectories
Urban Photochemistry NOx-VOC Sensitivity to O3 Production Less than 2 day old plumes VOC sensitive Model results along the flight path Megacity points from back trajectories Loss(N)/(Loss(N)+Loss(R)) NOx sensitive Model NOx (ppbv) Klienman et al., 2000
Urban Photochemistry NOx-VOC Sensitivity Implications • Ozone production in the urban plumes is VOC limited • Decrease in NOx may actually increase local O3 production • Though at present, NOx is contributing less to local O3 mixing ratios, it is contributing to local NO2 mixing ratios (health criteria pollutant) and to O3 production at downwind sites.
Ambient Concentration Exposure Emissions Air Quality Management System Policy Issues Technical Options Environmental Integrated Assessment
Trends in Urban Asia Sulfur PollutionModel Overview RAINS-Asia Developed by IIASA, Austria SO2, PM, NOx Energy, Emissions, Controls, Costs and Optimization modules ATMOS Dispersion Model SO2, PM, NOx Lagrangian Puff Transport Linear Chemistry NCEP Winds (1975-2000)
32o Shanghai East China Sea Shanghai Province 30o36’ 120o36’ 122o Environmental Integrated Assessment Case Study of Shanghai, China Emissions for 1995 PM10 : 166 ktons PM/year PM2.5 : 68 ktons PM/year Sulfur: 458 ktons SO2/year Population: 19 Million Source: Li and Guttikunda et al., 2002
Shanghai Urban Air Quality Management Emission Estimates Units: Gg/year 1995 2020 BAU
Shanghai Urban Air Quality ManagementAnnual Average PM10 Concentrations Units: mg/m3 PM10 in 1995 2020 BAU
Shanghai Urban Air Quality ManagementHealth Benefit Analysis Dose-response function coefficients Coefficient: % change in endpoint per 10 mg/m3 change in annual PM10 levels Incidence rate: rate of occurrence of an endpoint among the population
Shanghai Urban Air Quality ManagementHealth Benefit Analysis No. of cases avoided