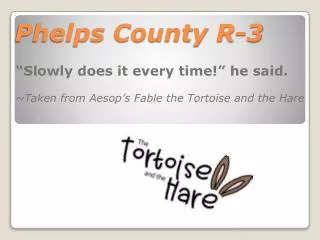
Phelps County R-3
Phelps County R-3. “Slowly does it every time!” he said. ~Taken from Aesop’s Fable the Tortoise and the Hare. Everyone wants one! . Magic Bullet . . . Beginnings Past Performance Hills/Valleys Finish Line. You Must Understand The Race!. TAKING STOCK!.

Phelps County R-3
E N D
Presentation Transcript
Phelps County R-3 “Slowly does it every time!” he said. ~Taken from Aesop’s Fable the Tortoise and the Hare
Everyone wants one! Magic Bullet . . .
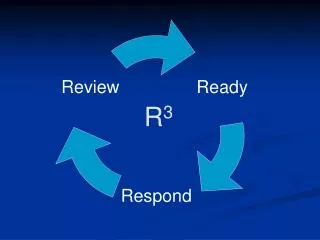
Beginnings • Past Performance • Hills/Valleys • Finish Line You Must Understand The Race!
TAKING STOCK! You want us to do WHAT?!? CHANGE?!
August 2010 • The journey begins • Building relationships • The question is. . . Here We Go!!
Poverty -- Understanding the culture we teach in. • PBiS • Behavior consistency from PK to 8th • Checking out other districts • Getting EVERYONE on board . . . • classroom teachers, bus drivers, paraprofessionals, cafeteria workers, and custodians. Is It Good for the Kids?
Teamwork • Is it good for kids? • Change….. Insanity:Doing the same thing over and over again and expecting different results. ~Albert Einstein PLC
TECHNOLOGY @PCR3
“We need technology in every classroom and in every student and teacher’s hand, because it is the pen and paper of our time, and it is the lens through which we experience much of our world.” – David Warlick A Few Thoughts . . .
Animoto – This is a site that can be used to create stunning presentations that include images, video clips, music and text. Mrs. Wainwright (our JH Language Arts teacher)is a fan and has had students create wonderful “book reports” that seem more like movie trailers. • Study Jams – Offered from Scholastic.com, this free site has interactive videos that cover major Math & Science topics that are suitable for 3rd and up. Practice quizzes, songs, and interesting characters are used to engage students. Great as a hook at the beginning of a lesson, or a summary towards the end. Our Favorite Websites!
This website is full of etools that can be incorporated in any classroom setting. http://jahan.wikispaces.com/Technology+in+Math+Classroom Our Favorite Websites (cont.)
COLLABORATION We have to work TOGETHER?
What is Collaboration? • Collaboration means to work jointly with others in order to achieve or do something especially in an intellectual endeavor. Collaboration
We didn’t have complete collaboration throughout the building. • Who was collaborating with whom? We didn’t know! • Major division between Elementary and Junior High – “Us and Them” In The Beginning . . .
Began slowly with building our new culture • Learning each other’s strengths and weaknesses • Trusting each other • Accepting constructive criticism and suggestions • Setting differences aside to work together Culture Building
A member from all four compass points • A member from each academic area PLC Leadership Team
PreK-8 with one teacher per grade level • Grouping • PreK-2nd • 3rd-5th with Art and Music • 6th-8th with P.E. • Resource Teachers Small PLC Groups
Writing Rubrics Aligned K-8 • Unwrap Missouri Learning Standards • Write “I Can” Statements Small PLC Groups (cont.)
DATA What’s data?
Data never really shared with the faculty • Overall MAP performance numbers • No individual student scores unless we asked • Did not understand the data given • Did not know what to do with the data given Data? What’s Data?
Three years ago we began collecting data • MAP Overall Performance • Individual Student Performance on MAP • Reading Data (STAR, Dibbles, Reading Eggs, ESGI) • Assessment Data • MAP Benchmarking Types of Data
The data paints the picture: • Data collection form shared throughout school • Data collection shows us what students need extra help or attention in the classroom • Data made us more focused on the goal • Data shows growth or lack of growth • Data can lead to differentiated learning by knowing what students need more time/effort/attention Now What?
GRADE: 7th Grade TEST AREA: COMM ARTS Green = on target Blue = small gap (-1 to -20 points)Pink = large gap (-20 or more points)NOTE: use scale score for present grade to determine score needed New Forms: MAP Tracking
GRADE: 7th Grade TEST AREA: COMM ARTS Green = on target Blue = small gap (-1 GL)Pink = large gap (-2 or more GL)NOTE: use present grade to determine score needed New Forms: STAR DATA
SPECIAL EDUCATION Where we were and where we are now!
“If the only tool you have is a hammer, it is tempting to treat everything as if it were a nail.” ~ Abraham Maslow (1966)
“ If the kid can’t cut it, why not just put them in special education. That is why we have it.” • Some teachers would conclude that the struggling students should transfer to a less rigorous course or should be considered for special education. First Response…Rather Than Last Response
Special education was the only significant intervention tool available in our school. • Because of it, we were relied upon too frequently. • There were harsh feelings about students not qualifying for special education. • Teachers would say, “If we wait long enough they will qualify.” • Some would lower their expectations by adopting less challenging standards for subgroups of students within classroom. • Some would look for ways to assist student before and after school. • Some would allow struggling students to slip through the cracks but move on anyway. How We Were as a School!!
We suffered from the DRIP Syndrome- Data Rich/Information Poor • Special Education has never lacked for Data; but we were not always turning this data into useful and/or relevant information. • Through PLC we have reviewed our data practices. • Now, Data has become the catalyst for improved teacher practices with comparison and collaboration. Special Education’s Journey
PLC Implementation • Collaboration between teachers and Special Education Teachers • RTI Implementation • School Problem not a Special Education Problem • Title I Reading • Assisting those students who are AT Risk to correct their deficiencies. Where We Are Now!
Special Education serves a tremendously important role in a school committed to success for all students. • However, special education staff working in isolation cannot ensure all students will learn. • In schools who create a systematic process to provide additional time and support for any student who experiences initial difficulties in learning; all students can learn in “the least restrictive environment”. Finally. . .
Run the same race TOGETHER • Train for the race - Know your Professional Development - Know your Kids - Know your Data - Know your Standards Teamwork
TEAM • T – Total • E – Everyone • A – Attitude and Attention • M - Matters Collaboration
Thank your TEAM • Celebrate your SUCCESS • Plan for CHANGES in the track • Train new RUNNERS on the team • Provide good SUPPORT for the returning runners • Meet the needs of your RUNNERS End of the Race!