Download
1 / 7
70 likes | 216 Vues
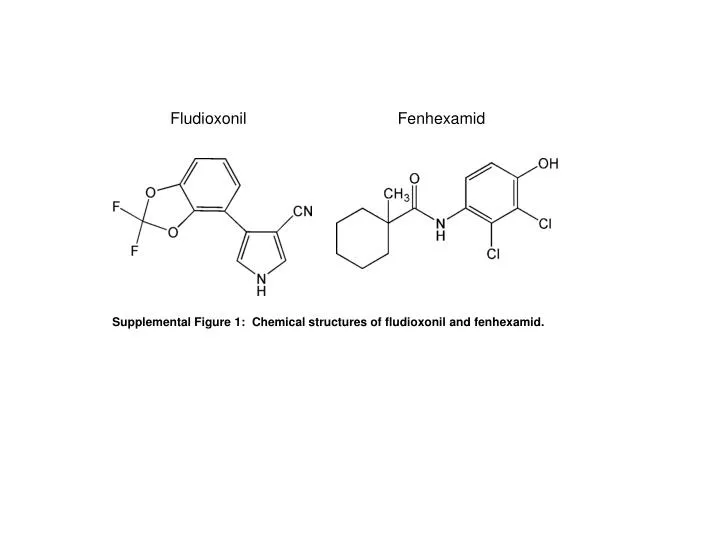
Fludioxonil. Fenhexamid. Supplemental Figure 1: Chemical structures of fludioxonil and fenhexamid. 23. 23. RNU38. RNU48. 22. 22. 21. 21. CT value. CT value. 20. 20. 19. 19. 18. 18. 17. 17. DMSO. 100nM Flu. 100nM Fen. DMSO. 100nM Flu. 100nM Fen. 22. 17. GAPDH. 18S. 21.

E N D
Fludioxonil Fenhexamid Supplemental Figure 1:Chemical structures of fludioxonil and fenhexamid.
23 23 RNU38 RNU48 22 22 21 21 CT value CT value 20 20 19 19 18 18 17 17 DMSO 100nM Flu 100nM Fen DMSO 100nM Flu 100nM Fen 22 17 GAPDH 18S 21 16 15 20 CT value CT value 14 19 13 18 12 17 11 16 DMSO 100nM Flu 100nM Fen DMSO 100nM Flu 100nM Fen Supplemental Figure 2:Fludioxonil and fenhexamid do not affect control genes used in Q-PCR. MCF-7 cells were ‘serum-starved’ for 72 h prior to treatment with DMSO (vehicle control), fludioxonil (Flu) or fenhexamid (Fen), as indicated for 6 h. A) RNU38 and B) RNU48 are used as controls in miRNA Q-PCR. C) GAPDH and D) 18S rRNA are used as controls in mRNA Q-PCR. Values are the mean ± SEM of 9 experiments.
Supplemental Figure 3: Fludioxonil and fenhexamid do not decrease ERa protein in MCF-7 cells. MCF-7 cells were seeded in 6-well plates and were ‘serum starved’ for 72 h prior to treatment with DMSO (vehicle control), 10 nM E2, 100 nM fludioxonil (Flu), 100 nM fenhexamid (Fen), or 100 nM 4-hydroxytamoxifen (4-OHT, an ER antagonist) for 48 h. 30 mg protein from whole cell lysates were separated by 10 % SDS-PAGE and immunoblotted for ERa. Membranes were stripped and re-probed for b-actin as a loading control. Immunoreactive bands were quantified and the ratio of ERa/b-actin normalized to the DMSO control is indicated.
DMSO E2 Flu Fen 150- PARP 116kDa PARP 85kDa 75- a-tubulin 7 6 5 % PARP cleavage 4 3 2 1 0 Fen E2 Flu DMSO Supplemental Figure 4: Fludioxonil and fenhexamid do not stimulate apoptosis in MCF-7 cells. MCF-7 cells were seeded in 6-well plates and cultured in phenol red-free IMEM +5% DCC-FBS for 48 h prior to treatment with DMSO (vehicle control), 10 nM E2, 100 nM fludioxonil (Flu), 100 nM fenhexamid (Fen) for 96 h. 30 mg protein from whole cell lysates were separated by 10 % SDS-PAGE and immunoblotted for PARP. Membranes were stripped and re-probed for a-tubulin. Intact (116 kDa) and cleaved (85 kDa) PARP were measured and the percentage of PARP cleavage was calculated from the formula % PARP cleavage = C/ C+F *100 where C = the 85 kDa cleaved band and F = the full length 116 kDa band.
2.0 CCND1 PGR ESR1 ESR2 * * * 1.5 # # # Relative mRNA Expression 1.0 # # # * # * # * * * * * * * 0.5 0.0 DMSO E2 Flu Fen E2 + Flu E2 + Fen Supplemental Figure 5: Fludioxonil and fenhexamid have antiestrogenic activity in MCF-7 cells. MCF-7 cells were serum-starved for 48 h and then treated with DMSO, 10 nM E2, 100 nM fludioxonil, or 100 nM fenhexamid, alone or in combination, as indicated for 6 h. CCND1 (cyclin D1), PGR (progesterone receptor, PR), ESR1 (ER), and ESR2 (ER) expression was determined by Q-PCR. Values are the average of triplicate determinations within one representative experiment. Statistical analysis used one way ANOVA followed by Dunnett’s Multiple Comparison Test. * P < 0.05 versus DMSO (control). # p < 0.05 versus 10 nM E2.
16 18S rRNA CT values 15 CT 14 13 12 DMSO E2 100nM Flu 100nM Fen E2 + Flu E2 + Fen Supplemental Figure 6:Fludioxonil and fenhexamid do not affect 18S rRNA control gene expression in MCF-7 cells. MCF-7 cells were ‘serum-starved’ for 72 h prior to treatment with DMSO (vehicle control), 10 nM E2, or 100 nM fludioxonil or 100 nM fenhexamid, as indicated for 24 h. 18S rRNA was used as a control for RT-Q-PCR for Figure 6. Values are the mean +/- SEM of triplicate determinations.
CCND1 2.5 BCL2 MDA-MB-231 2.0 * * * 1.5 RelativeExpression 1.0 * * * 0.5 0.0 100 nM Flu 10 nM Flu 10 nM Fen 100 nM Fen E2 DMSO Supplemental Figure 7: Fludioxonil and fenhexamid do not increase cyclin D1 expression in ERa-negative MDA-MB-231 cells. MDA-MB-231 cells were serum-starved for 48 h and then treated with DMSO, 10 nM E2, 10 or 100 nM fludioxonil or fenhexamid, as indicated for 6 h. CCND1 (cyclin D1), BCL2, PGR (progesterone receptor, PR) expression was determined by Q-PCR. PGR was not expressed in MDA-MB-231 (CT values > 38). Values are the average of triplicate determinations within one representative experiment. Statistical analysis used one way ANOVA followed by Dunnett’s Multiple Comparison Test. * P < 0.05 versus DMSO (control).