Download
1 / 1
10 likes | 138 Vues
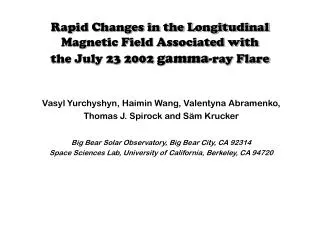
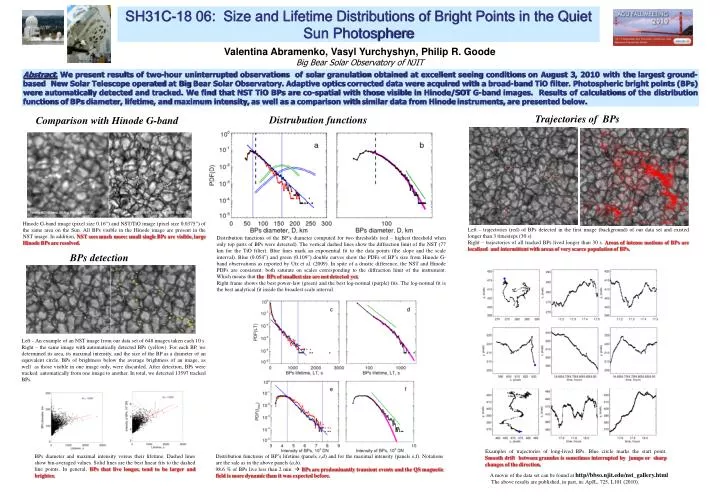
SH31C-18 06: Size and Lifetime Distributions of Bright Points in the Quiet Sun Photosphere. Valentina Abramenko, Vasyl Yurchyshyn, Philip R. Goode Big Bear Solar Observatory of NJIT.

E N D
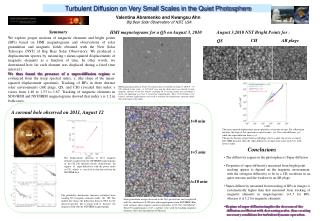
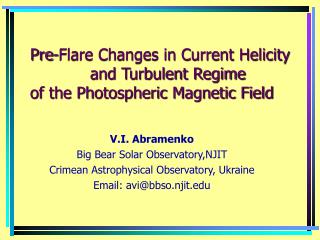
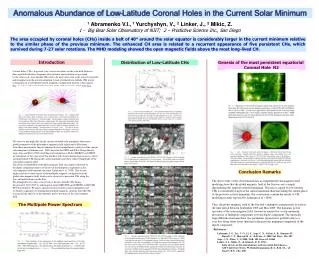
SH31C-18 06: Size and Lifetime Distributions of Bright Points in the Quiet Sun Photosphere Valentina Abramenko, Vasyl Yurchyshyn, Philip R. Goode Big Bear Solar Observatory of NJIT Abstract. We present results of two-hour uninterrupted observations of solar granulation obtained at excellent seeing conditions on August 3, 2010 with the largest ground-based New Solar Telescope operated at Big Bear Solar Observatory. Adaptive optics corrected data were acquired with a broad-band TiO filter. Photospheric bright points (BPs) were automatically detected and tracked. We find that NST TiO BPs are co-spatial with those visible in Hinode/SOT G-band images. Results of calculations of the distribution functions of BPs diameter, lifetime, and maximum intensity, as well as a comparison with similar data from Hinode instruments, are presented below. Trajectories of BPs Distrubution functions Comparison with Hinode G-band Hinode G-band image (pixel size 0.16”) and NST/TiO image (pixel size 0.0375”) of the same area on the Sun. All BPs visible in the Hinode image are present in the NST image. In addition, NST sees much more: small single BPs are visible, large Hinode BPs are resolved. Left – trajectories (red) of BPs detected in the first image (background) of our data set and existed longer than 3 timesteps (30 s). Right – trajectories of all tracked BPs lived longer than 30 s. Areas of intense motions of BPs are localized and intermittent with areas of very scarce population of BPs. Distribution functions of the BP’s diameter computed for two thresholds (red – highest threshold when only top parts of BPs were detected). The vertical dashed lines show the diffraction limit of the NST (77 km for the TiO filter). Blue lines mark an exponential fit to the data points (the slope and the scale interval). Blue (0.054”) and green (0.109”) double curves show the PDFs of BP’s size from Hinode G-band observations as reported by Utz et al. (2009). In spite of a drastic difference, the NST and Hinode PDFs are consistent: both saturate on scales corresponding to the diffraction limit of the instrument. Which means that the BPs of smallest size are not detected yet. Right frame shows the best power-law (green) and the best log-normal (purple) fits. The log-normal fit is the best analytical fit inside the broadest scale interval. BPs detection Left - An example of an NST image from our data set of 648 images taken each 10 s. Right – the same image with automatically detected BPs (yellow). For each BP, we determined its area, its maximal intensity, and the size of the BP as a diameter of an equivalent circle. BPs of brightness below the average brightness of an image, as well as those visible in one image only, were discarded. After detection, BPs were tracked automatically from one image to another. In total, we detected 13597 tracked BPs. Examples of trajectories of long-lived BPs. Blue circle marks the start point. Smooth drift between granules is sometimes interrupted by jumps or sharp changes of the direction. BPs diameter and maximal intensity versus their lifetime. Dashed lines show bin-averaged values. Solid lines are the best linear fits to the dashed line points. In general, BPs that live longer, tend to be larger and brighter. Distribution functions of BP’s lifetime (panels c,d) and for the maximal intensity (panels e,f). Notations are the sale as in the above panels (a,b). 98.6 % of BPs live less than 2 min BPs are predominantly transient events and the QS magnetic field is more dynamic than it was expected before. A movie of the data set can be found at http//bbso.njit.edu/nst_gallery.html The above results are published, in part, in: ApJL, 725, L101 (2010).