Download
1 / 1
10 likes | 163 Vues
t=0 min. CH. t=5 min. t=10 min. Turbulent Diffusion on Very Small Scales in the Quiet Photosphere. Valentina Abramenko and Kwangsu Ahn Big Bear Solar Observatory of NJIT, USA. Summary. HMI magnetograms for a QS on August 3, 2010. August 3,2010 NST Bright Points for :.

E N D
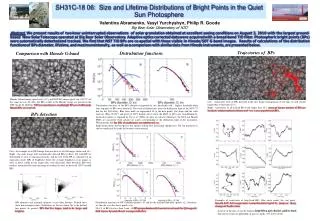
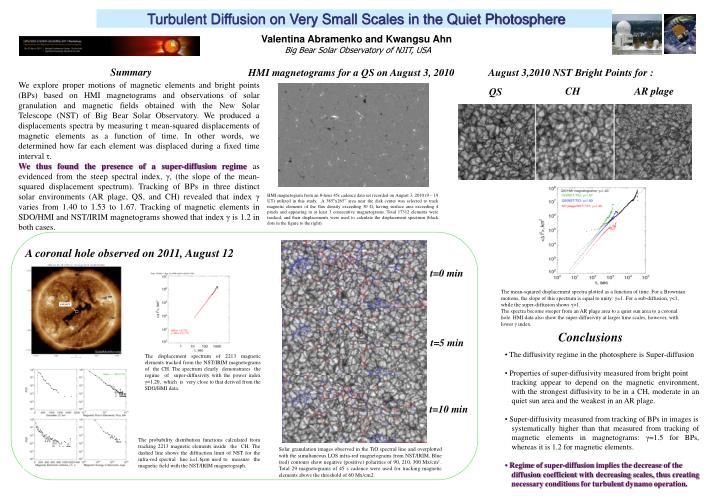
t=0 min CH t=5 min t=10 min Turbulent Diffusion on Very Small Scales in the Quiet Photosphere Valentina Abramenko and Kwangsu Ahn Big Bear Solar Observatory of NJIT, USA Summary HMI magnetograms for a QS on August 3, 2010 August 3,2010 NST Bright Points for : We explore proper motions of magnetic elements and bright points (BPs) based on HMI magnetograms and observations of solar granulation and magnetic fields obtained with the New Solar Telescope (NST) of Big Bear Solar Observatory. We produced a displacements spectra by measuring t mean-squared displacements of magnetic elements as a function of time. In other words, we determined how far each element was displaced during a fixed time interval τ. We thus found the presence of a super-diffusion regimeas evidenced from the steep spectral index, γ, (the slope of the mean-squared displacement spectrum). Tracking of BPs in three distinct solar environments (AR plage, QS, and CH) revealed that index γ varies from 1.40 to 1.53 to 1.67. Tracking of magnetic elements in SDO/HMI and NST/IRIM magnetograms showed that index γ is 1.2 in both cases. CH AR plage QS HMI magnetogram from an 8-hour 45s cadence data set recorded on August 3, 2010 (9 – 19 UT) utilized in this study. A 385”x265” area near the disk center was selected to track magnetic elements of the flux density exceeding 30 G, having surface area exceeding 4 pixels and appearing in at least 3 consecutive magnetograms. Total 17312 elements were tracked, and their displacements were used to calculate the displacement spectrum (black dots in the figure to the right). A coronal hole observed on 2011, August 12 The mean-squared displacement spectra plotted as a function of time. For a Brownian motions, the slope of this spectrum is equal to unity: γ=1. For a sub-diffusion, γ<1, while the super-diffusion shows γ>1. The spectra become steeper from an AR plage area to a quiet sun area to a coronal hole. HMI data also show the super-diffusivity at larger time scales, however, with lower γ index. FOV/NST Conclusions • The diffusivity regime in the photosphere is Super-diffusion • Properties of super-diffusivity measured from bright point • tracking appear to depend on the magnetic environment, with the strongest diffusivity to be in a CH, moderate in an quiet sun area and the weakest in an AR plage. • Super-diffusivity measured from tracking of BPs in images is • systematically higher than that measured from tracking of magnetic elements in magnetograms: γ=1.5 for BPs, whereas it is 1.2 for magnetic elements. • Regime of super-diffusion implies the decrease of the • diffusion coefficient with decreasing scales, thus creating necessary conditions for turbulent dynamo operation. The displacement spectrum of 2213 magnetic elements tracked from the NST/IRIM magnetograms of the CH. The spectrum clearly demonstrates the regime of super-diffusivity with the power index γ=1.20, which is very close to that derived from the SDO/HMI data. The probability distribution functions calculated from tracking 2213 magnetic elements inside the CH. The dashed line shows the diffraction limit of NST for the infra-red spectral line λ=1.6µm used to measure the magnetic field with the NST/IRIM magnetograph. Solar granulation images observed in the TiO spectral line and overplotted with the simultaneous LOS infra-red magnetograms from NST/IRIM. Blue (red) contours show negative (positive) polarities of 90, 210, 300 Mx/cm2 . Total 29 magnetograms of 45 s cadence were used for tracking magnetic elements above the threshold of 60 Mx/cm2.