Solar Dynamics Observatory
290 likes | 445 Vues
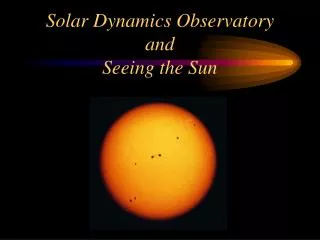
Solar Dynamics Observatory. W. Dean Pesnell NASA, Goddard Space Flight Center SDO Project Scientist. The Sun Today What is SDO? The instruments on SDO How much data will be generated and why we built those antennas.

Solar Dynamics Observatory
E N D
Presentation Transcript
Solar Dynamics Observatory W. Dean Pesnell NASA, Goddard Space Flight Center SDO Project Scientist SDO, W. Dean Pesnell, SVECSE Meeting, June 2008
The Sun Today • What is SDO? • The instruments on SDO • How much data will be generated and why we built those antennas It is however remarkable that tho’ large Spots are seen gradually to become small ones, no one has observ’d a small Spot gradually to become a large one; at least I do not remember to have met with such an Observation. A letter from Benjamin Franklin (in London) to Humphry Marshall (in Pennsylvania), Feb. 1773 SDO, W. Dean Pesnell, SVECSE Meeting, June 2008
The Sun Today Left: Active region 10030 in a full-disk view and a closeup. To understand solar activity it is necessary to have data of the whole Sun and the fine detail that shows the effect of the magnetic field. But visible light misses much of what happens on the Sun. • Sunspots are the best known way to observe solar activity • Sunspots are dark splotches that rotate with the Sun • They are cool material with strong magnetic fields • Measured and reported every day by several groups • Active regions are groups of sunspots and related items • Solar activity is more or less correlated with sunspot number SOHO/MDI July 15, 2002 SST, La Palma, July 15, 2002 SDO, W. Dean Pesnell, SVECSE Meeting, June 2008
The Sun Today He I 304 Å from SOHO (50,000 K) TRACE loops (roughly 1.5 million K) From space we can see the Sun in UV and X-rays that are absorbed by the Earth’s atmosphere. The loops and swirls are created by material moving along magnetic fields. SDO, W. Dean Pesnell, SVECSE Meeting, June 2008
The Sun Today As we move into solar minimum the large loops are fading and the coronal holes at the poles and equator are the featured presentation. Some people think the shape and location of coronal holes may help us predict future solar activity. EIT Fe XII 195 Å (roughly 1.5 million K) SDO, W. Dean Pesnell, SVECSE Meeting, June 2008
An Ultrasound of the Sun Helioseismology uses sound to see into and through the Sun-like thunking a watermelon Right: Farside images show the active regions that launched the largest flares ever measured. We can see them on our side at top, continuing around the Sun in the middle and re-appearing at the bottom. The middle view is two weeks after the top and the bottom two weeks later. The velocities under a sunspot show that material moves toward the spot near the surface and away from the spot lower down. SDO, W. Dean Pesnell, SVECSE Meeting, June 2008
An Ultrasound of the Sun A vertical cut through the outer 1% of the Sun showing flows and temperature variations inferred by helioseismic tomography. These measurements show the short-term behavior of a small part of the Sun-truly Solar weather! The meridional and zonal velocities inside the Sun. These velocities are inferred from helioseismic measurements and represent the evolution of the solar convection zone. SDO, W. Dean Pesnell, SVECSE Meeting, June 2008
“Seeing” Magnetic Fields • Magnetic fields cause much of what we call solar activity • The Sun rotates faster at the equator than the pole—an essential ingredient for the dynamo that creates the field deep in the Sun, it then rises to the surface • Most of the magnetic field that emerges from the Sun sinks back into the Sun (like an alligator putting its head above water) The magnetic butterfly diagram. The blue and yellow regions move toward the equator and switch hemispheres each sunspot cycle. (NASA/MSFC) 23 SC21 22 SDO, W. Dean Pesnell, SVECSE Meeting, June 2008
EUV:The Heartbeat of SWx • The solar spectral irradiance causes much of what we call space weather • This irradiance has been reported by SEE on TIMED as daily and orbital values • Identifying the sources of this irradiance is a major goal of SDO SDO, W. Dean Pesnell, SVECSE Meeting, June 2008
Solar Dynamics Observatory The Solar Dynamics Observatory (SDO) is the first Living With a Star mission. It will use telescopes to study the Sun’s magnetic field, the interior of the Sun, and changes in solar activity. Some of the telescopes will take pictures of the Sun, others will view the Sun as if it were a star. • The primary goal of the SDO mission is to understand, driving towards a predictive capability, the solar variations that influence life on Earth and humanity’s technological systems by determining: • How the Sun’s magnetic field is generated and structured • How this stored magnetic energy is converted and released into the heliosphere and geospace in the form of solar wind, energetic particles, and variations in the solar irradiance. SDO, W. Dean Pesnell, SVECSE Meeting, June 2008
SDO: NASA/LWS Cornerstone Solar Mission • NASA and three Instrument Teams are building SDO • NASA/ Goddard Space Flight Center: build spacecraft, integrate the instruments, provide launch and mission operations • Lockheed Martin: AIA • Stanford University: HMI • LASP/University of Colorado: EVE • Launch is planned for December 2008 on an Atlas V EELV from Cape Canaveral • SDO will be placed into an inclined geosynchronous orbit ~36,000 km (21,000 mi) over New Mexico for a 5-year mission • Data downlink rate is 150 Mbps, 24 hours/day, 7 days/week (a 2-hour movie every 4 minutes; 500,000 iTune downloads each day) Atlas V carries Rainbow 1 into orbit, July 2003. SDO, W. Dean Pesnell, SVECSE Meeting, June 2008
The Sun Today A goal of NASA’s Living With a Star Program is to predict how the Sun affects our lives thru Space Weather. What data do we need to make those forecasts, today, next year, and the next solar cycle? Comparisons of solar models with data have tended to be qualitative. Don’t have the proper initial or boundary conditions. Don’t have adequate data. Don’t include all the physics in our models. No longer. Helioseismology gives us the conditions inside the Sun today. Images of coronal loops tell us the magnetic field and plasma properties today. SDO, W. Dean Pesnell, SVECSE Meeting, June 2008
The Sun Today Convection Zone Magnetic Field Solar Activity Space Weather Problems SDO, W. Dean Pesnell, SVECSE Meeting, June 2008
The Sun Today Every time you hit a golf ball it goes somewhere. Every model of the Sun explains something. But expecting a random model to explain today’s Sun is like using a random trajectory to explain the next golf shot. The lack of current information, such as the wind, temperature, dirt on the ball, and the golfer’s condition, complicates modeling the trajectory. Many models of the solar convection zone exist. They can explain characteristics of the convection zone but cannot represent “The Sun Today” because they do no use solar data as initial or boundary conditions. LWS data and models are the next step toward understanding The Sun Today. ?= Boo Weekley SDO, W. Dean Pesnell, SVECSE Meeting, June 2008
The SDO Spacecraft EVE (looking at CCD radiator and front) AIA (1 of 4 telescopes) The total mass of the spacecraft at launch is 3200 kg (payload 270 kg; fuel 1400 kg). Its overall length along the sun-pointing axis is 4.5 m, and each side is 2.22 m. The span of the extended solar panels is 6.25 m. Total available power is 1450 W from 6.5 m2 of solar arrays (efficiency of 16%). The high-gain antennas rotate once each orbit to follow the Earth. High-gain antennas Solar arrays HMI (looking down from top) SDO, W. Dean Pesnell, SVECSE Meeting, June 2008
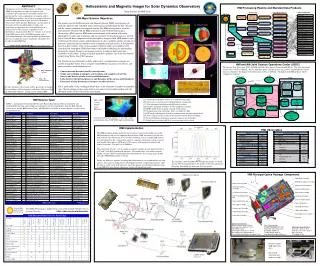
EUV Variability Experiment • Extreme ultraviolet Variability Experiment (EVE) • Built by the Laboratory for Atmospheric and Space Physics at the University of Colorado in Boulder, CO • Data will include • Spectral irradiance of the Sun • Wavelength range 0.1-105 nm plus Ly1215 • Full spectrum every 10 s • Space weather indices from photodiodes • Information needed to drive models of the ionosphere • Cause of this radiation • Effects on planetary atmospheres SDO, W. Dean Pesnell, SVECSE Meeting, June 2008
EVE Flight Box CCD Radiator Alignment Cube SAM ESP MEGS A MEGS B Kinematic Mounts SDO, W. Dean Pesnell, SVECSE Meeting, June 2008
Helioseismic & Magnetic Imager • HMI is the Helioseismic and Magnetic Imager • Built at Stanford University and Lockheed Martin in Palo Alto, CA • Two 4096 x 4096 CCDs • Instrument is designed to observe polarized light to measure the magnetic field • Data will include • Doppler velocities • Oscillations • Local Analysis • Longitudinal magnetograms • Vector magnetograms HMI and AIA will use 6 4096 x 4096 CCDs built by e2v in England. SDO, W. Dean Pesnell, SVECSE Meeting, June 2008
HMI Optics Package Internal Harness Shutters BDS Fold Mirror Alignment Mechanism BDS Beamsplitter CCD Fold Mirror Detector Assembly Oven Controller ISS Beam Splitter Flex-Cables CEB ISS Mirror Limb Sensor Polarization Selector Limb Pre-amp Box Focus/Cal Wheels Telescope Structure W/ legs and heaters Front Window Optics Package Assembly SDO, W. Dean Pesnell, SVECSE Meeting, June 2008
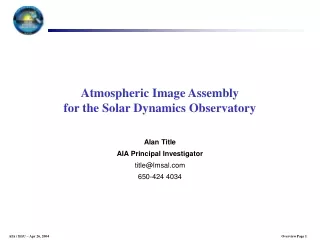
Atmospheric Imaging Assembly • AIA is the Atmospheric Imaging Assembly • Built at Lockheed Martin Solar and Astrophysics Laboratory in Palo Alto, CA • Four telescopes with filters to select the required wavelength • Filters are at 94, 131, 171, 193, 211, 304, 335, 1600, 1700, and 4500 Å • 4096 x 4096 CCD • Multi-layer coatings on mirrors • Data will include • Images of the Sun in 10 wavelengths • Coronal lines • Chromospheric lines • An image every 1.25 seconds • Guide telescope for pointing SDO SDO, W. Dean Pesnell, SVECSE Meeting, June 2008
AIA Telescopes Guide telescope CCD Electronics Box Non-flight scissors Front door and filters SDO, W. Dean Pesnell, SVECSE Meeting, June 2008
AIA Telescopes AIA’s goal is to resolve ambiguities in coronal loop evolution that could be caused by either density or temperature changes. AIA observes the coronal plasma with 1.5 arc second (1200 km) spatial resolution and a 10 second cadence, over a wide and continuous temperature range. Using a set of Iron (Fe) lines minimizes abundance effects while giving a broad spectral coverage. The Helium (He II 304) and Carbon (C IV 1600) lines extend temperature coverage to the transition region and chromosphere. A UV continuum (1700 Å) and white light continuum (4500 Å) complete the set. Fe XVI 335 Fe XX/ XXIII 131 UV Fe IX/X 171 He II 304 Fe XVIII 94 Fe XIV 211 Fe XII 193 SDO, W. Dean Pesnell, SVECSE Meeting, June 2008
AIA Data & Research • Images of the Sun in eight bandpasses that cover the temperature range 50,000 K to 3 million K • Images of the corona and chromosphere • The dissipation and redistribution of magnetic field • Coronal seismology, understand the magnetic field by the waves generated along a coronal loop • Combined with the magnetic field of HMI, models of the magnetic field throughout the corona Magnetic field model for September 23, 2004; created from magnetogram data. White lines are loops connecting one part of the Sun to another; green lines are “open”, they do not connect back to the Sun’s surface. AIA will combine their images with the HMI vector magnetograms to build more accurate models. SDO, W. Dean Pesnell, SVECSE Meeting, June 2008
Calibration of AIA Data SDO, W. Dean Pesnell, SVECSE Meeting, June 2008
SDO Operations • Operations Philosophy • Few modes: turn it on and let the data flow! • Images are sent to the ground for processing • Data is made available soon after downlink; people can use the data in near-real-time • Campaigns and collaborations are coordinated when convenient, but the data is always available • Science teams plan operations of the instruments with MOC and analyze the data. • Mission Operations Center for SDO is at NASA's Goddard Space Flight Center near Washington, DC. • Maintain its inclined geosynchronous orbit • Keep SDO pointing at the Sun • Keep the data flowing. • Communications with the spacecraft are via two radio dishes at NASA's White Sands Complex in New Mexico. MOC in Building 14 18 m antennae at STGT SDO, W. Dean Pesnell, SVECSE Meeting, June 2008
SDO Operations • SDO will produce an enormous amount of data • 1.5 Terabytes each day • Almost 0.75 petabytes each year • DDS acts is the first data recorder • Data is forwarded to SOCs, who archive and serve the data • Two copies exist at all times after data is on the ground Data Distribution System being test in Building 14 (60 TB raid storage) SDO, W. Dean Pesnell, SVECSE Meeting, June 2008
SDO Construction SDO’s Propulsion Module being assembled in Building 10 (module was designed and built by GSFC) SDO’s Flight Structure being assembled in the SCA in Building 7 SDO, W. Dean Pesnell, SVECSE Meeting, June 2008
SDO Construction SDO’s spacecraft bus being placed over the Propulsion Module in the SCA at Goddard on October 27, 2007. SDO, W. Dean Pesnell, SVECSE Meeting, June 2008
Contact Information • W. Dean Pesnell: dean.pesnell@gsfc.nasa.gov • http://sdo.gsfc.nasa.gov SDO, W. Dean Pesnell, SVECSE Meeting, June 2008