Download
1 / 19
190 likes | 329 Vues
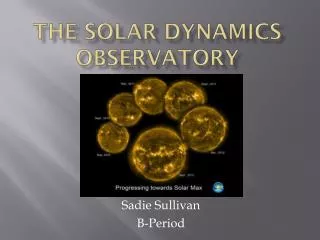
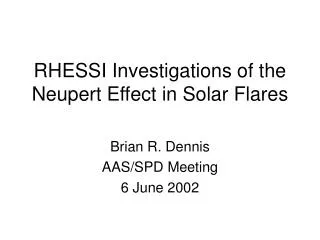
New Observations of the Neupert effect with the Solar dynamics observatory. Sam Schonfeld Mentor: Phil Chamberlin. Outline. Background Solar flare m odel Instruments The Neupert Effect Research, initial findings 9 Mar 2011 X1.5 24 Feb 2011 M3.5 Conclusions / future work.

E N D
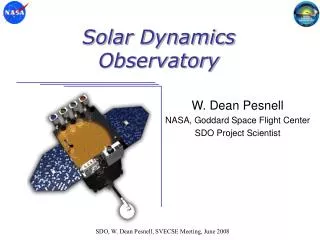
New Observations of the Neupert effect with the Solar dynamics observatory Sam Schonfeld Mentor: Phil Chamberlin
Outline • Background • Solar flare model • Instruments • The Neupert Effect • Research, initial findings • 9 Mar 2011 X1.5 • 24 Feb 2011 M3.5 • Conclusions / future work 7-Jun-2011 304Å
The Basic Solar Flare Model • Flares occur in active regions • Energy released by magnetic reconnection accelerates non-thermal electrons and ions • Electron and ion beams travel down magnetic loops into the Transition Region and Chromosphere where they release Bremsstrahlung radiation • Energy deposited by electron and ion beams raises the temperature (and pressure) of denser chromosphere plasma • Increased pressure leads to chromosphericevaporation, filling the magnetic loops with denser plasma
Instruments • ReuvenRamaty High Energy Solar Spectroscopic Imager (RHESSI) • HXR irradiance spectroscopy and imaging • Geostationary Operational Environmental Satellites (GOES) • SXR irradiance, used for flare classification • Solar Dynamics Observatory (SDO) • Atmospheric Imaging Assembly (AIA) • Imager in 7 EUV band passes • Extreme Ultraviolet Variability Experiment (EVE) • EUV irradiance spectroscopy
The Neupert Effect • Werner M. Neupert observed a correlation between the timing of peak microwave and soft x-ray emissions and that the integrated (in time) microwave emission approximately matched the soft x-ray profile (Neupert 1968) • Datlowe, Elcan and Hudson (1974) observed that in most flares a hard x-ray burst occurs shortly before the soft x-ray peak • These initial discoveries and further work have led to the statement of the Neupert Effect: • During the impulsive phase of a flare: SXR(t) or equivalently: • High percentage of flares expected to show this correlation • ~80% (Dennis, Zarro)
Conclusion • EUV spectral components of flares are observable with EVE and AIA • Chromospheric foot point heating can be observed in He-II 304Å emission line • Only ~40% of flares show clear Neupert Effect with strong temporal correlation between SXR derivative, 25-50 keV RHESSI HXR and He-II 304Å • Likely due to complexity and circumstances of flare, not a problem with the flare model • Things I didn’t have time to mention • Initial statistical analysis revealed He-II peak shows poorly constrained dependence on flare class • NeupertEffect events tend to show interesting temperature evolution • Simultaneous cooling and heating trends • Further Work • Examine more EUV lines • Use OSPEX to analyze HXR spectra • Continue statistical analysis
References • Neupert, W. M.: 1968, Astrophys. J. 153, L59. • Datlowe, D. W., Elcan, M. J., and Hudson, H.S.: 1974, Solar Phys. 39,155. • Dennis, B. R., and Zarro, D. M.: 1993, Solar Phys. 146, 177-190. • Allred, J. C., Hawley, S. L., Abbett, W. P., and Carlsson, M.: 2005, 630, 573. • All images not made by me were found through Google
Signature Flare Emissions • Non-thermal hard x-ray (HXR) continuum produced in loop footprints by Bremsstrahlung radiation • Thermal HXR continuum can also be produced in loops • SXR released by thermal plasma filling the flaring loops • Flares classified by peak soft x-ray (SXR) continuum emission • Extreme Ultraviolet (EUV) line emission from plasma with T=10,000K—107K (and higher) found in Chromosphere, Transition region and Corona • Visible light emitted in white light flares • Microwave and Radio 7-Mar-2011 171Å