Tools to Achieve Performance Excellence
530 likes | 778 Vues
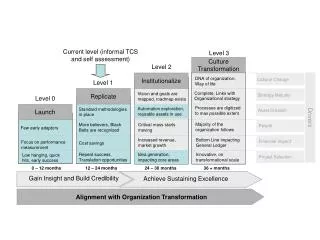
Tools to Achieve Performance Excellence. Winona Health’s Continuous Systems Improvement (CSI) Lean 2.0 - Activities to Results!. Linda Wadewitz Director of Continuous Systems Improvement Winona Health. Activity to Results. Strategy not aligned Sustainment issues Lack of Standard Work

Tools to Achieve Performance Excellence
E N D
Presentation Transcript
Winona Health’s Continuous Systems Improvement (CSI)Lean 2.0 -Activities to Results! Linda Wadewitz Director of Continuous Systems Improvement Winona Health
Activity to Results • Strategy not aligned • Sustainment issues • Lack of Standard Work • Discipline/Accountability • Leaders Std Work • RCA-Frontline • ……thus LEAN 2.0
CSI as a Strategy • Focus on Principles of: • Belief this strategy is key to a successful future for transforming our culture at Winona Health
CSI Goals • Deployment of Lean 2.0 • Integration of the LMS enterprise wide • A3 (PDCA) Thinking • Strategy cascaded to Frontline • Patient focused – outcomes and results • Coaching and Mentoring
What is Lean 2.0? • Strategy Deployment/Enterprise Obeya • Visual Management/PDCA/FB • Cascading metrics • Daily Management – Leadership Discipline • Standard Work - 80/20 • Leaders Standard Work • Frontline A3 Problem Solving • Coaching and Mentoring • Results Driven – Course Corrections • Thus…Activity to RESULTS with lean 2.0
Customer Value • Patient/Resident Satisfaction - True North • Principle 1 • True North drives - Hoshin • Value Stream mapping – starts with patient flow • Process mapping – Kaizen, CIP’s • A3 Problem solving • Visual Management • FOCUS Boards • PDCA Boards
Hoshin Management = Strategy Deployment • Statement is the CONSTANT GUIDE for the Team Hoshin Kanri Direction/Needle Management • Hoshin Kanri – Leadership Driven • Level 1- Organization – True North/3 year Strategic Goals • Level 2 – Service Line or Support • Level 3 – Value Streams/Departments • Linkage from Level 1 to Level 2 to Level 3 • Catchball between all levels
“Catchball” Process • CEO/Service Line Leaders/Directors • Discussions between Leadership levels • Need to limit the “How”/# of Tactics • Level 3 catchball includes frontline • Improves ownership/engagement at all levels • Integrated goals cascade from Level 1 - Level 3 • Alignment and focus
Level-1 #1 lags everything #2 is leading to #1 but lagging to #3 #3 is leading to #2 but lagging to #4 #4 is leads everything 2 Metrics Level-2 1 3 Proposal A3’s Level-3 4
Forecasting - What We Did • Eliminated Annual Budget Process • Implemented Quarterly Forecasting • Designed overall process • Operationalize software • Initiated Quarterly Senior Leader meeting
Forecasting - Why We Did It • Agility– annual budget process is out of synch • Pace of change in the industry • Winona Health management system • Lead Time too long – 17 months
Forecasting - Why We Did It • Noise– Budget becomes noise that gets in the way of real-time continuous performance improvement
Forecasting – Why We Did It • Waste – time and resources
Observations/Impact/Lessons Learned • Start with Long-Term Financial Forecast to determine targets • Use Quarterly Forecasting to evaluate progress on Long-Term targets • Close the Loop on gaps between Quarterly Forecast and LT Targets • This is primarily a top-down exercise, resist creating a quarterly budget process
Observations/Impact/Lessons Learned • Quarterly Forecasting meeting has created enhanced dialogue among Senior Leaders • Preparation for the quarterly meeting has triggered a more meaningful interaction between finance and operations • Operating leaders are asking more and better questions • You have to learn to walk again
Observations/Impact/Lessons Learned • Quarterly Forecasting: • Is about performance improvement • Is not about precision or paper clips • The point of forecasting is not creating numbers to “hit”. It’s about designing operations to deliver better performance.
Proposal A3’s • Proposal A3’s-all levels of Hoshin – “HOW” • What tactics we use to accomplish breakthrough objectives and how do you measure for success • Started by leader / finished by area • Burning platform • Also used for CPR’s presented to CEO/CFO
Proposal A3 Future State Business Case Action Plan Current State/Gap Measurement/Results
Visual Management Enterprise • PDCA Enterprise Level • Plan wall • Hoshin Level 1 and Level 2’s • Proposal A3’s from level 1 Hoshin • Long term goals and forecast • Do wall • Proposal A3’s from all level 2 Hoshin • Check wall • Std Boxscores from every Service/Support Line • Charts/Graphs not meeting target • Results tracking to forecasting • Act wall • Follow-up – Course Corrections
Visual Management-PDCA Boards PDCA Boards – Level 2 and 3 (SL/Dept) • New format with Standard Work • Box Score – Vital few – Level 2 and 3 • Reviewed weekly, monthly and quarterly
Visual Management FOCUS Boards • FOCUS Boards- Daily- every dept • New format with Standard Work • A3 Problem solving at frontline • More meaningful than old version
Standard Work • Standard work at the frontline-goal 20% • Based on risk and volume • Critical to quality steps on a scorecard audit • Improves outcomes and quality • Process stable prior to improvement • Decreases variability • Standard work for Leadership • Standard set of tasks all leaders or managers perform • Same expectations/outcomes-quality • Accountability • Staff see the same process in all leaders
Leaders Standard Work • Leaders Standard Work cascaded up from frontline to the CEO • Daily, weekly and monthly audits • Done with a score card • Gemba walks/Rounding • Coaching and Mentoring- 4-Patterns • Visual Board Rounding
Standard Work / LSW Risk Matrix Standard Work Template LSW Score Card
Scorecard Requirements • Cascaded frontline to CEO • Vital few – one on/one off • Discipline at all levels • Reviewed at 1:1 leaders mtg • Follow-up to issues and commitment from either party • 4- Patterns guides actions • Live tool-changes as needed
Frontline Daily Problem Solving • 22 Coaches trained • 75 Frontline Problem Solvers trained • 6 additional groups trained • > 200 A3’s since January 2013 • > 140 A3’s closed out of the 200 • New A3 Format • Healthcare sensei December 2012 • In addition to FB and JDI’s
Problem Solving A3 Problem Statement Target Condition Background Current State Countermeasures Implementation Plan Problem Analysis Gap Follow-up Actions and Metrics Cost Benefit Analysis
Recognition Program • New-previously not done well, if at all • Access Data Base to track results • Hard dollars saved • Revenue enhancement • Hours saved • Satisfaction – lagging • Reports
Recognition Reports • Executive Summary – Financial and time • Weekly Recognition-report detailing closed A3’s • teams are recognized at the FOCUS Boards by the Service Line Leaders. • Monthly Recognition – CEO highlights monthly and tells the story…. • Annual Celebration
Value Realization Hours saved Reassigned to “new” work A3 Problem solvers/Coaches Have a “no lay off” policy related to “CSI” Attrition Forecasting adjusted if appropriate Hard Dollar Savings 75% adjustment in forecasting Validation required in intervals Forecasting adjusted if appropriate
Why Leadership Academy? • Developing out people • Respect for our people • Use of talent • Grown your bench • Staff Satisfaction = Increased Patient Satisfaction
Results • Strategy patient focused, aligned and integrated from Hoshin to the frontline • Sustainment with Results using Std Wk/LSW • Improved visual management • Engagement at all levels with A3 problem solving (critical thinking) and FOCUS/PDCA boards • Enterprise results monitored and addressed by the CEO and Senior Leadership Team with course correction and follow-up when needed • Results reflected in measurement and metrics