Air Pollution Mitigation Strategies for Transportation Congestion in Delhi
The India-California Air Pollution Mitigation Program (ICAMP) emphasizes innovative approaches to tackle air pollution from the transportation sector, particularly in densely populated areas like Delhi. This initiative explores the dramatic increase in vehicle numbers, from 55 million in 2001 to 141 million in 2011, presenting a significant challenge in managing traffic congestion and its consequential air quality impacts. The presentation covers best practices in congestion mitigation relevant to Indian conditions, highlighting the need for strategic interventions to enhance sustainability in urban transportation.

Air Pollution Mitigation Strategies for Transportation Congestion in Delhi
E N D
Presentation Transcript
India-California Air-Pollution Mitigation Program (ICAMP) Initiative for Air Mitigating Pollution from the Transportation Sector Congestion Management Dr.Kayitha Ravinder & Dr Errampalli Madhu Principal Scientist CSIR-Central Road Research Institute New Delhi-25 5th February 2014
Presentation Outline • Introduction • Overview of the Congestion Mitigation Measures • Congestion Mitigation measures feasibility/ relevance to Indian (Delhi) conditions • Conclusions
Introduction- Vehicle Growth (India) Vehicles plying on Indian roads increased from 55 million (2001) to 141 million (2011) About 10% annualgrowth during 1991-2001,12% (2001-05) and16 to18% (2005-2011)
Introduction- Vehicle Growth (India) Total Number of Registered Vehicles Maharashtra-17.4 m, Tamil Nadu-15.6 m, UP-13.3 m, Gujarat-13.0 m, AP-10.2 m, Karnataka-9.9 m Almost 50% of vehicles in Six States
Introduction- Vehicle Growth (India) Delhi is at top with about 7 million followed by Bangalore, Chennai and Hyderabad Delhi ≈ 2*Bangalore Delhi ≈ 2*Chennai Delhi > 2*Hyderabad Delhi ≈ Bangalore+Chennai Delhi >Mumbai+Chennai+Kolkata Total Number of Registered Vehicles in Million Plus Population Cities in India (2011)
Introduction - Vehicle Growth (Major Cities in India) * *7,496,190 (Sept 2012) 11% of metropolitan cities population having 32% Vehicle registration Out 32% vehicles 13% of vehicles concentrated in Delhi, Mumbai, Kolkata & Chennai 53.5 % in Delhi and rest 46.5% in (Mumbai, Kolkata & Chennai)
Introduction- Vehicle Growth (India) Almost 9% Heavy Duty Vehicles (Buses, HCVs and LCVs) Composition of Total Number of Registered Vehicles in India (2011)
Introduction-Vehicle Production 19,271,808 India is sixth largest vehicle/car manufacturing industry in the world.
Domestic Vehicle Sale Trends in India Two wheelers constitute more than 75% of the total registered vehicles Cars sales share has increasedfrom 13% (2004-05) to 16% (2010-11) Two wheeler sales share has decreased from 79% (2004-05) to 76%(2010-11)
Car Ownership in Mega Cities in India 2001 Car modal share is between 30-40% of the total traffic in mega-cities, the vehicle share of car is only 8-14% % of cars is increasing, the peak hour journey speed is decreasing Comparing it with public transport, it constitutes about 10-20% of the total traffic & its modal share is 30-55%.
Summary of Traffic Volume Counts at Selected Mid-block Locations Maximum Traffic Flow at ITO Bridge (Mid-block) 2.3 Lakhveh/day and NH-8 Toll Plaza (Outer Cordon) with 2.27 Lakhveh/day (3.27 Lakh/day in July 2013 with peak hour 25,000 vehicles/hr) Summary of Traffic Volume Counts at Selected Intersections Maximum Traffic Flow at Ashram Chowkwith 3.65 Lakhveh/day (4.25 Lakhveh/day in 2013)
Typical Hourly Variation and Traffic Composition Total Vehicles : 1,92,395/day Lala Lajpath Rai Marg Total Vehicles : 3,64,871 vehicles/day (1,35,173 v/d flyover traffic) At Ashram Intersection
Comparison of Traffic Composition on Delhi Road Network (2009) 2002 2009 1992 Cars (with high) & Two Wheeler (with mild) grown (varies from 75-83%) All others reduced
Impacts of increasing Car Ownership Levels • Congestion • Air Pollution • Accidents Car ownership increases as income increases Car ownership rises with per-capita income even among the developed countries.
Impacts of increasing Car Ownership Levels-Pollution • Vehicle Emission loads
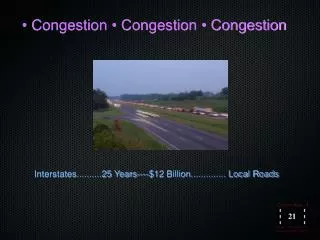
Impacts of Congestion in Delhi: Capital get stuck in traffic snarls at least six times a month. At least about 10.24 lakh vehicles daily entry/ exit into Delhi Road network ( CRRI 2009 study) If all the vehicles plying on the Road is parked on Delhi roads. No space still vehicles exceeds the road space According to 2009-10 CRRI study, on average 6 years will be lost in traffic Jams out of total 30 years of career
Estimated Traffic Load (VKT/day) on Delhi Road Network for the year 2010 and 2015 • For any City to be sustainable ,..target is reduce ?????
Summary of Best Practices for Congestion Mitigation Measures and their Relevance in Delhi’s Scenario * ** ** **
Summary of Best Practices for Congestion Mitigation Measures and their Relevance in Delhi’s Scenario * ** **
Summary of Best Practices for Congestion Mitigation Measures and their Relevance in Delhi’s Scenario *** ***
Part-I: Car Ownership Restraint Measures • In the present traffic scenario of Delhi, do you recommend restricting?
Part-I: Car Ownership Restraint Measures (Continued..) • What are the major factors behind increasing car ownership in Delhi
Part-I: Car Ownership Restraint Measures (Continued..) • What are the de-merits of restraining car ownership?
Part-I: Car Ownership Restraint Measures (Continued..) • What policy options, should be adopted for restricting car ownership in Delhi. (Rate them in order of relevance to restrict car ownership in Delhi) (Rating - 1 being least important & 5 being most important)
Part-I: Car Ownership Restraint Measures (Continued..) • What policy options, should be adopted for restricting car ownership in Delhi. (Rate them in order of feasibility to restrict car ownership in Delhi) • (Rating - 1 being not feasible in Delhi’s Scenario & 5 being highly feasible in Delhi’s Scenario)
Car Ownership Restraint Measures (Continued..) • What policy options, should be adopted for restricting car ownership in Delhi? Relevance Feasible √ √ (Rating - 1 being least important & 5 being most important)
PART II: Car Use Restraint Measures • What are the major factors behind increasing car usage? (Rate them in terms of their importance as a contributing factor to increasing car ownership) (Rating - 1 being least important & 5 being most important)
Part-II: Car Use Restraint Measures (Contd..) • Which policy should be adopted for restricting car usage in Delhi. (Rate them in order of relevance to restrict car usage) - Relevance (Rating - 1 being not relevant & 5 being very relevant)
Part-II: Car Use Restraint Measures (Contd..) • Which policy, should be adopted for restricting car usage in Delhi. (Rate them in order of relevance to restrict car usage) - Feasibility (Rating - 1 being not feasible & 5 being highly feasible)
Part-II: Car Use Restraint Measures (Contd..) • Which policy, should be adopted for restricting car usage in Delhi. (Rate them in order of relevance to restrict car usage) Relevance Feasibility √ √ √ X √ √ (Rating - 1 being not feasible & 5 being highly feasible)
Part-II: Car Use Restraint Measures (Contd..) • Should congestion pricing be based on:
Part-II: Car Use Restraint Measures (Contd..) • What are the pre-requisites, for implementing congestion pricing? (Rating - 1 being least important & 5 being most important)
Part-II: Car Use Restraint Measures (Contd..) • What should be threshold cost for congestion pricing?
Part-II : Car Use Restraint Measures (Contd..) • What is feasible to implement car pooling & travel plans strategy?
Conclusions • Vehicle Registration and Traffic is increasing rapidly at urban centers in India • Resulting in negative externalities Congestion, Air pollution, Accidents • Considering the Indian Socio-Economic and Polity Conditions. We should first attempt pilot study before we implement any policy • For the Indian Conditions we should attempt multi –policy oriented; only single policy do not work for sustainable transportation.
Part-II : Car Use Restraint Measures (Contd..) • Regarding Parking fee which will be more effective?