3. Data Presentation
3. Data Presentation. Graphs & Charts. Graphs.

3. Data Presentation
E N D
Presentation Transcript
3. Data Presentation Graphs & Charts
Graphs • Graphs are pictorial presentations of data. They should be chosen to enable the data to be displayed in the most effective and clear way possible. All diagrams must be fully labelled, and care must be taken to select an appropriate scale so the data is not in any way capable of misrepresentation. All graphs should be accompanied by a sentence or two of explanation.
Bar Charts • A bar chart is a diagram consisting of columns (bars), the heights of which indicate frequencies. A histogram is similar to a bar chart, but without gaps between columns. However, although bar charts can only be used with discrete data (categories such as gender etc.) on the x axis, histograms can use continuous data (measurement of time etc.).
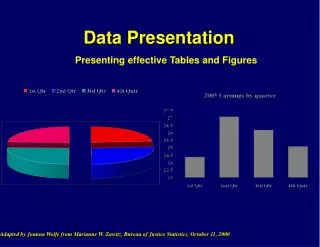
Pie Chart • A pie chart is particularly suitable for displaying how a population is divided up into different parts and what proportion of the whole each portion represents. The bigger the proportion, the bigger the slice of pie!!
Line Graph • Line graphs are used to show a trend over time or how a participant’s experiences change. The x-axis on a line graph must always use continuous units of measurement, for example time. • A Histogram can also be used to display continuous data, when the bars are joined with a line, this is known as a frequency polygon.
Scatter graph • Correlations look for a relationship between two variables. This is not to say that one thing causes another, simply that one thing varies in accordance with another. Correlations are displayed on a scattergraph
Normal Distribution • Characteristics of a normal distribution curve, also know as a bell-shaped curve or a Gaussian curve: - • It is bell-shaped • It is symmetrical • The, mean, median and mode all fall on the same central point. • The two tails never touch the horizontal axis.
Bar Chart –Displays frequencies of discrete data Pie Chart – Displays proportions of the whole population Line Graph – Displays trends using continuous data Scattergraph – Displays correlations Normal Distribution – Expected pattern of many human characteristics such as IQ, height & weight etc. Summary