Download
1 / 32
320 likes | 482 Vues
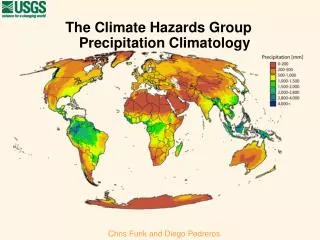
Precipitation Analyses for Climate Applications Pingping Xie 2013.08.14. Objectives. History and current status Illustrate some applications List products available. CPC Started as CAC. Climate Analysis Center created 1979

E N D
Precipitation Analysesfor Climate ApplicationsPingping Xie2013.08.14.
Objectives History and current status Illustrate some applications List products available
CPC Started as CAC Climate Analysis Center created 1979 The CAC missions include the real-time monitoring of climate anomalies along with diagnostic studies relating the anomalies to historical conditions Two Branches Diagnostics Branch Prediction Branch
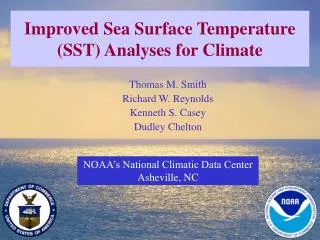
The Diagnostics Branch Branch Chief Gene Rasmusson Major projects included Ocean (R.W. Reynolds) Precipitation and tropical Convection (P.A. Arkin) Precipitation / Temperature Anomaly (C.F. Ropelewski) ENSO Evolution(G. Rasmusson) Collecting and constructing observation data key to the success of the projects Construction of climate data sets started Global SST OLR Global Precipitation Station Precipitation and Temperature over Land
Early Efforts in constructing Precip Data Sets Station Data 1979 Started archiving GTS daily station reports 1984 Created CAMS (Climate Anomaly Monitoring System) for monthly precipitation and temperature Satellite Estimates 1979 Developed GPI (GOES Precipitation Index) technique to derive precipitation estimates from IR data 1981 Began routine production of GPI using histograms from GOES IR 1982 Started the OLR archive 1985 Hosted the workshop initiated the GPCP 1986GPCP launched GPIcovers the tropical belt GPIused for climate monitoring
The GPI Global PrecipitationSample for July 2007 Successful depiction of tropical precipitation Available only over tropics (40oS-40oN) Poor performance for non-convectiive precipitation Smooth spatial structure
SSM/I Improves Precipitation Estimates Time 1987 ~ Scientific Requirements Global precipitation data with complete coverage and improved quality Technical Developments PMW instruments aboard Special Sensor Microwave / Imager Products Algorithms / Products developed by many groups Emission-based algorithms over ocean Scatter-based algorithms over land Monthly precipitation estimates on 2.5olat/lon Available 3-4 months afterwards till ~1999 Real-time monitoring impossible CAC utilized SSM/I-based precipitation estimates fordiagnostics
The SSM/I-Based PrecipitationSample for July 2007 Estimates extend into extra-tropics Improved quality (e.g. over E. Pacific) Noisy caused by limited sampling
CAL/VAL/Inter-Comparisons for better understanding of the products performance Time 1991 – 2000(?) Scientific Requirements Understanding quantitative accuracy of the satellite products Identifying products with better performance Technical Developments Availability of multiple sets of satellite precipitation estimates Activities Proposing / Participating several intercomparison projects GPCP Algorithm Intercomparison Project (AIP) NASA Precipitation Intercomparison Project (PIP) Major conclusions MERGINGof individual information sources is necessary to improve the quality of precipitation analysis
CMAP CPC Merged Analysis of Precipitation Time 1993 - 1998 Scientific Requirements Monitoring and diagnosing climate variability ofinter-annualandintra-seasonaltime scales Verifying reanalyses and climate model simulations Technical Developments Routine production of gauge analysis and satellite estimates Improved understanding of error structures of input data Activities Developed CPC Merged Analysis of Precipitation 2.5olat/lon grid over the entire globe Monthly / pentad from 1979 to the present Standard / Real-time versions
Quest for An Extended RecordGauge-based Analysis over Global Land Time 1998-2002 Scientific Requirements Inter-ENSO variability and long-term Variations Technical Developments Availability of improved station data base (GHCN) Activities Developing OI-based PREC (Precipitation Reconstruction) Gauge-based analysis over land 0.5olat/lon grid; monthly, 1948 - EOF reconstruction over ocean
Pursuit for high-resolution [1]Regional Gauge-Based Analysis over Land Time 1996-2004 Scientific Requirements Weather-climate linkage Hydrometeorology (e.g. soil moisture) Technical Developments Availability of daily station archives for several regions Improved computing / storage capacity Activities Created regional analyses of DAILY precipitation on high-resolution (0.125o, 0.25o, 0.5o) Regions include US-MEXICO and Brazil (Higgins and Shi), and east Asia (Xie et al.)
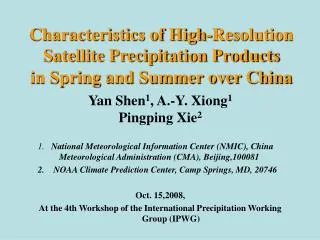
Pursuit for high-resolution [2]High-Resolution Combined Satellite Estimates over the globe Time: 1999-2006 Scientific Requirements: Weather-climate linkage / Hydrometeorology / MJO / Tropical Storm Technical Developments: Real-time high-resolution MW estimates from multiple platforms Real-time high-resolution IR data over the entire globe High-performance workstation Actions Developed global full-resolution IR system Developed CMORPH (CPC Morphing Technique) MW estimates interpolated through IR cloud moving vectors 8kmx8km / 60oS-60oN / 30 min interval from Dec.2002
CPC Unified Precipitation Products [1] Time 2006 Scientific Requirements One single suite of precipitation data sets serving for most (if not all) applications Actions Started the CPC Unified Precipitation Products Project
CPC Unified Precipitation Products [2] Overall Goals To create a single suite of unified precipitation products for various global / regional applications To improve the quantitative accuracy and consistency of the products Components An archive of quality controlled station reports Monthly, Daily, Hourly precipitation A collection of satellite-based precipitation estimates Precipitation estimates from individual platforms Combined satellite estimates (CMORPH) A suite of precipitation analyses Gauge-based, gauge-satellite merged Monthly, Pentad, Daily, Hourly Global, Regional Retrospective, Real-time State-of-the-art objective techniques Short-term Goals Gauge-based analysis of daily precipitation over global land Gauge-satellite merged analysis of daily precipitation over the entire globe
CPC Unified Precipitation Products [3]The Global Daily Gauge Analysis >30K station reports Enhanced networks over US, Mexico, Brazil, Australia GTS elsewhere Optimal Interpolation (OI) with orographic correction (Xie et al. 2007) 0.5olat/lon grid over global land Daily fields from 1979 to present Real-time operations Finished development / construction
CPC Unified Precipitation Products [4]Gauge Station Distribution • Daily reports from over 30,000 stations worldwide • Distributed unevenly with more gauges over US, Brazil, Australia, and Europe • Gauge reports available only from <400 Indian stations through GTS
CPC Unified Precipitation Products [5]Example of Daily Gauge Analysis for July 1, 2003 • Major precipitation activities well depicted with reasonable details
CPC Unified Precipitation Products [6]Gauge-Satellite Merged Analysis of Global Daily Precipitation Combining daily gauge analysis with CMORPH Prototype objective algorithm developed to define the analysis in two steps Removing the CMORPH bias through comparison with gauge Combining bias-corrected CMORPH with gauge through OI Merged analysis consistent with gauge analysis 0.25olat/lon grid over the entire globe Daily fields from 2000 to the present
CPC Unified Precipitation Products [7]Sample gauge and merged analyses for August 2, 2007
CPC Unified Precipitation Products [8]Sample merged analyses for June, 2008
Applications [1]Evaluation of Reanalyses JJA Precip. JJA Mean for 1998 – 2010 Spatial pattern of precipitation, especially that associated with topography, well reproduced by the reanalyses Larger oceanic precipitation in CFSR and ERA-I Weaker precipitation over mid-latitude compared to the CMORPH Heavier rainfall over Maritime-continent
Applications [2]Precipitation Diurnal Cycle Standard deviation of 24 hourly means for 1998-2010 (mm/day) Diurnal amplitude in CFSR is very similar to that in the observations but presents smaller / larger over ocean, extra-tropical land / tropical land Diurnal amplitude in MERRA is generally smaller than that in the observations over tropics and extra-tropics in northern hemisphere and is almost diminished over extra-tropics in southern hemisphere
Applications [3]Precipitation Diurnal Cycle over Maritime Amplitude (mm/day) color shading Arrow timing (LST) of maximum hourly precipitation (N=00; E=06; S=12; W=18) Spatial pattern of amplitude in association with land / sea contrasts CFSR represent minimum amplitude over ocean along coast lines Phase in general agreement with observations
Applications [4]Diurnal Cycle over Four Selected Regions Peak in the reanalyses comes earlier Amplitude in the reanalyses is larger / smaller over tropical land / ocean
Applications [5]Diurnal Cycle over CONUS Longitude section (X-axis) of diurnal evolution (Y-axis) along 40oN over CONUS Diurnal cycle (Y-axis) repeated twice Precipitation starts from the eastern Rocky around early afternoon (20GMT), traveling eastward and reaching 90oW late afternoon the next day Diurnal cycle over land east of 90oW presents fixed phase, opposite to that of precipitation over nearby ocean Neither CFSR nor MERRA captures this diurnal variation patterns very well
Comparisons between instantaneous SSS from Aquarius with precipitation averaged over different periods ending at the SSS observation times Data collected over central Pacific [10oS-10oN; 180o-160oW] In general, SSS decreases with P Better agreement between SSS and P averaged over a longer period Applications [6]Precipitation and SSS over Central Pacific
Applications [7]Driving Hydrological Models Courtesy of Y.Zhang et al. of OU
CPC Merged Analysis of Precipitation (CMAP) • Monthly / pentad from 1979 to the present • 2.5olat/lon over the entire globe • Monthly global gauge analysis (PREC/L) • monthly from 1948 to the present • 0.5olat/lon over the global land • Daily global gauge analysis (CPC Unified) • global land: 0.5olat/lon from 1979 • CONUS: 0.125olat/lon from 1948 • CMORPH satellite estimates • 8km x 8km over the globe from 60oS-60oN • 30-min interval from Jan.1, 1998 to the present • Satellite-only and bias-corrected versions Data Sets AvailablePrecipitation