Download
1 / 17
170 likes | 245 Vues
Discover the latest in SST analysis, with daily high-resolution data from satellites and in situ sources. Compare data coverage and gradients across different products for enhanced climate diagnostics. Explore bias corrections, gradients, and standard deviations for a comprehensive understanding.

E N D
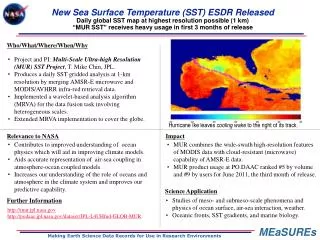
Improved Sea Surface Temperature (SST) Analyses for Climate Thomas M. Smith Richard W. Reynolds Kenneth S. Casey Dudley Chelton NOAA’s National Climatic Data Center Asheville, NC
Optimum Interpolation (OI) SST Analysis • A NOAA SST analysis, widely used for climate diagnostics and analysis • Data: in situ (ship and buoy) and operational satellite (AVHRR) SSTs blended for global coverage • Record: November 1981 to present • Resolution: weekly on 1o spatial grid • Analysis method: preliminary satellite bias corrections followed by OI analysis
New Higher Resolution SST OI Analysis • Resolution: Daily, 0.25o • Data: Satellite plus in situ (ship and buoy) data • Satellite data to include • Infrared AVHRR: Longest satellite data set • Microwave AMSR: Not impacted by clouds so better coverage than infrared • 7-Day large-scale satellite bias correction for each satellite so analysis OK for climate • Initial results shown for 2003 • Separate analyses using AVHRR and AMSR to examine impact of different satellite data
Jan 2003: Pathfinder Number of days • Top panel: Daytime • Bottom Panel: Nighttime • From the figure note: • Regions north of 40°N and south of 40°S have roughly only 5 days of data. • Number increases toward the tropics to roughly 15 days except for ITCZ and SPCZ regions
Jan 2003: AMSR Number of days • From the figure note: • Better coverage than AVHRR • Regions north of 40°N and south of 40°S have more than 20 days of data • Drop offs occur from • Sun glint near 60°S in day • Definition of day near 160°W for day & 20°E for night • Toward equator due to swath width & Earth sphere • In ITCZ and SPCZ regions due to precipitation
First Focus on SST Gradients • Examine Daily OI (1/4°grid) • Constant e-folding spatial scale (100 km) • Constant noise to signal ratio (1) • 3 versions • Pathfinder AVHRR • Operational Navy AVHRR • AMSR • Compare with • OI.v2 (weekly, 1°) • RTG_SST (daily, 1/2° grid)
Jan 2003: Mean SST Gradient • From the figure note: • Sparse AVHRR data • AMSR data missing near coast otherwise almost complete • OI.v2 gradients very weak • Daily OI and RTG gradients are similar • AMSR OI has strongest gradients due to better data coverage than AVHRR
Magnitude of Gradient:Gulf Stream • Daily OI using AMSR for January - March 2003 • Gradients are quasi stationary due to topography • Thus, limited AVHRR data are useful
Jan 2003: Mean Gradient for 3 Daily OIs and Data • From the figure note: • OI gradients using Pathfinder AVHRR weaker the OI using Operational AVHRR • Difference is due to data coverage • AMSR data missing near coast otherwise almost complete • Differences among products much smaller in summer because AVHRR coverage better
Magnitude of Gradient: Tropical Eastern Pacific • Daily OI using AMSR for August - October 2003 • Gradients propagate westward • Limited coverage not as useful here • Monthly averaging smooths out most of gradient signal
1 Oct 2003: SST Daily Gradient • From the figure note: • Very Sparse AVHRR data • AMSR data missing near coast between swaths and in ITCZ • Some features lost in AVHRR
Second Focus on Means and Standard Deviations • Examine Daily OI (1/4°grid) • Variable e-folding spatial scales & noise to signal ratios • 3 versions • Pathfinder AVHRR • Operational Navy AVHRR • AMSR • Compare versions with and without bias correction
18 Month SST Average Difference:Pathfinder - AMSR • Top: NO correction • Pathfinder much colder than operations in tropics • ITCZ & SPCZ: Pathfinder cloud bias? • Aerosols in Atlantic and Indian? • Bottom: Bias corrected • Differences much reduced but residual remains • Unexplained bias increase off east coast US
Jan 2003: Bias Corrections • Top: Pathfinder correction • Bottom: AMSR correction • Algorithm and error characteristics independent for IR and microwave • Note similar corrections in tropical Indian Ocean & Western Pacific plus Northern Mid-latitudes • These locations include heavy ship traffic and may be due to warm ship biases • Possible AMSR coastal warm bias?
Jan 2003: Standard Deviation Top: Pathfinder Bottom: AMSR • AMSR has stronger standard deviations than Pathfinder • Especially in mid-latitude winter • Clouds reduce Pathfinder sampling • This differences plus gradient differences suggest that separate Pathfinder OI and Pathfinder + AMSR OI needed
July 2003: Standard Deviation Top: Pathfinder with - without Bias Bottom: AMSR with- without Bias • Bias correction typically adds a small extra standard deviation • Note extra standard deviation at 30°N & Dateline • suggests an in situ data problem • Differences also suggest ship tracks: e.g., Australia to Panama
Daily OI SST Work Planned • Reexamine the daily OI statistics for both the bias correction and the SST analysis • Test improved estimates of bias and errors • 2 separate satellites can help understand bias better and lead to improved bias adjustment • Preliminary analysis with Pathfinder AVHRR by the end of 2005 • Reanalysis efforts will extend • Daily OI analysis using Pathfinder AVHRR back to January 1985 • Daily OI analysis using Pathfinder AVHRR and AMSR back to June 2002 • Additional satellite data to be tested and possibly used