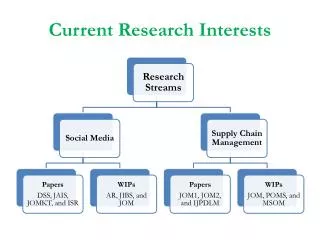
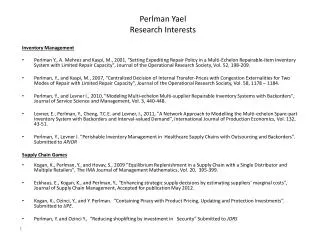
Research Interests
Information Technology and Information Producers: What will our economy look like in 50 years? February 12, 2002 Virginia Franke Kleist, Ph.D. West Virginia University. Research Interests. 1. Long term impact of information technology (IT) on firm organizational structures

Research Interests
E N D
Presentation Transcript
Information Technology and Information Producers: What will our economy look like in 50 years?February 12, 2002Virginia Franke Kleist, Ph.D.West Virginia University
Research Interests 1. Long term impact of information technology (IT) on firm organizational structures 2. Unique economics of the information goods producing firms (IGF) and electronic commerce 3. Value, performance, productivity and measurement issues of information systems investment 4. Economics of establishing security in networks 5. Long term effects of IT in society
1. Long Term Effects of Information Technology and Information Goods on Market Structures • Information technology may make it easier for firms to acquire inputs • Firms may tend to get smaller with IT • Information goods production has certain unique economics • Information goods producers may tend to get larger • What will market structures look like in the years ahead?
2. Unique economics of the information goods producing firms (IGF) and electronic commerce • Information goods may act differently than other goods • Information goods are more like public goods, have economies of scale and scope • Once “post-tipping point,” may exhibit network externalities • Do successful IGF’s outperform other firms? • Are the .com failures partially attributable to the information goods phenomenon?
3. Value, performance, productivity and measurement issues of information systems investment • Difficult to establish a return on investment (ROI) for information technology • Historical patterns to metrics used for ROI are similar to the technologies themselves • Department of Justice ROI study • Knowledge Management ROI study
4. Economics of establishing security in networks • Technologies of network security have improved over time • As technologies of trust improve, the cost of transactions in electronic markets falls • As tools of electronic trust improve, have less need for reliance on human trust in electronic commerce • Long term effects of electronic security on the development of electronic markets
5. Long term effects of IT in society • IT and underemployment of women and Hispanics • IT and IP telephony • IT and complex transformation of art: e.g., time and installations, ease of replication, loss of sound in MP3’s, avatars vs. reality, melding of culture, instruments and songs by single artist, the technology becomes the art form, linear thinking vs. hypermedia, collaborative work and intellectual property
Detailed discussion of IT, IGF and market transformations • Theoretical model • Research model • Hypotheses • Measurement • Results • Implications
The Electronic Markets Hypothesis • Electronic Markets Hypothesis (EMH) predicts that IT will lead to the staged dissolution of vertical firm boundaries • After the alliance phase, the EMH implies that vertical, fully neutral electronic markets will emerge in an IT enabled business world • EMH predictions have not been well verified empirically
But, Anecdotal Evidence of Alliances and Mergers for Information Goods Producing Firms, e.g.: • AOL/Netscape • MCI/Worldcom/Sprint • AT&T/TCI • Microsoft/Visio • Ernst and Young LLP/Cap Gemini • GTE/Bell Atlanticom • AOL/Time Warner
Information Producing Firms are Showing Trend of Increasing Mergers and Acquisitions 5000 4000 Mergers and Acquisitions (Worldwide Data) 3000 2000 1995 1996 1997 1998 estimate YEAR Source: Broadview and Assoc.
An information goods firm is a firm where information goods products are the firm’s primary source of revenue. Can think of information goods as bits, while non- information goods are atoms (Negroponte 1995) Decision making (legal case archive, newspaper) Entertainment (songs on CD, tape, videos) Inputs for production (Software, marketing database) Service moving a digital bit stream (telecom or cable TV) What is an Information Goods Producing Firm (IGF)? Definition of IGF: Examples of IGF:
Role of IT in Driving Boundary Change: • Vertical Boundaries: IT reduces the cost of transactions causing firms to make alliances for the purpose of acquiring the input goods needed for production • Horizontal Boundaries: IT reduces the coordination costs of being large in markets. • e.g., Malone, Yates and Benjamin (1987); Gurbaxani and Whang (1991); Clemons and Row (1991); Clemons, Reddi and Row (1993); Bakos and Brynjolfsson (1993); Brynjolfsson, et al. (1994)
Drivers for IGF Vertical Boundary Change • IGF’s may have higher transactions costs due to valuation and intellectual property issues • IGF’s may have higher “connectedness” in design architecture (Lessig 1999, Milgrom 1992) • IGF’s may need to develop future products at same time as current to keep up with market pace (Shapiro and Varian 1999) • IGF’s use tacit, asset specific human inputs in the production process
Drivers for IGF Horizontal Boundary Change • IGF’s products may have positive network externalities, leading to market failure • IGF’s production may have economies of scale in large deployments within markets, with high barriers to entry • IGF’s production may have increasing returns to scale • IGF’s products may act more like public goods than private goods • IGF’s may have economies of scope, extending across large markets
TheoreticalModel The EMH: - to mergers, + to alliances Information Technology Intensity of the Firm Vertical Firm Boundary + Information Goods Intensity of the Firm Horizontal Firm Boundary +
Research Model Vertical Integration Changes via Mergers/Sales _ Information Technology Intensity of Firm + Vertical Integration Changes via Alliances/Sales + + + + Information Goods Intensity Production Intensity Horizontal Integration Changes via Alliances/Sales + + Horizontal Integration Changes via Mergers/Sales
Agway, Inc. AutoZone, Inc. Clorox Corp. Hershey Foods, Inc. Scott Paper Co. William Wrigley, Jr. Sherwin-Williams, Co. American Express Co. AT & T GTE Corp. MCI Telecom Northwest Airlines Donnelley & Sons TCI Data: High/High Firms Vs. Low/Low Firms Low/Low High/High
total of all raw counts 140 120 100 80 60 40 Frequency Std. Dev = 53.15 20 Mean = 32.9 N = 317.00 0 0.0 20.0 40.0 60.0 80.0 100.0 120.0 140.0 160.0 180.0 200.0 220.0 240.0 260.0 280.0 300.0 320.0 340.0 360.0 380.0 total of all raw counts Data: Raw Counts of Merger and Alliance Event Data from WSJ “Hits” for Raw Search Terms: E.G., VENTURE, AGREEMENT, ALLIANCE, PARTNERSHIP, COALITION, LICENSE, LINK MERGER, ACQUSITION, PURCHASE, EXCHANGED STOCK n= 317 Firms
Data: Coded Mergers and Alliance Data from WSJ Vertical and Horizontal Boundary Expansion Activity n= 317
Tested Hypotheses: Vertical Integration Changes via Mergers/Sales Information Technology Intensity of Firm H1 H2** Vertical Integration Changes via Alliances/Sales H5** H6 H3 ** Information Goods Intensity Production Intensity Horizontal Integration Changes via Alliances/Sales H4** H7* H8 * Horizontal Integration Changes via Mergers/Sales
Results: IT Intensity and Scaled Vertical Mergers/Sales (H1)
Results: IT Intensity and Scaled Vertical Alliances/Sales (H2)
Results: Interaction of IT and IGF and Scaled Horizontal Mergers/Sales High IGF Firms with High IT have fewer horizontal mergers/sales than High IGF firms with Low IT (significant with post hoc Tukey test of means) :
Contributions of Research • Measurement of information goods producing firms, IT and horizontal and vertical boundary expansion • Model differentiating vertical and horizontal boundary expansion • Some support of EMH • Introduction of information goods firms into the electronic markets hypothesis discussion • Results indicating that information goods producers have different boundary expansion behaviors when compared to non-information goods producers
Future Research • Do these effects hold when controlling for the age of the firms, industry type, stock price expectation management or market exuberance? • Policy issues if IGF’s tend to have more mergers and alliances both horizontally and vertically? • Are ecommerce firms similar to IGF’s? • Evidence of Increasing Returns for IGF’s? Will “post tipping point” digital products be more profitable in the electronic commerce world? • Is there a horizontal electronic markets hypothesis? In ecommerce? • Do firms with more sophisticated IT have enhanced financial performance?
MANOVA Results of IT Intensity and IGF to Scaled Horizontal Activity: H5, H6, H7, H8
Data: Graph of Dependent Variable Frequencies Number of Events Type of Boundary Expansion
Data: IT Intensity Raw Data Used for Scaling Frequency Highest Expenditure Reported on Questionnaire
Data: IGF Scaling Hi/Lo IGIPF Scaled Hi/Lo 300 200 100 Frequency Std. Dev = .40 Mean = 1.20 N = 317.00 0 1.00 2.00 IGF Scaled Hi/Lo