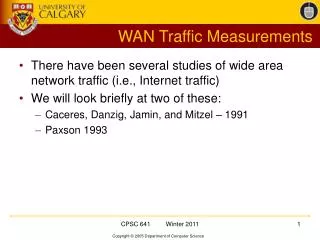
WAN Measurements
WAN Measurements. Carey Williamson. Department of Computer Science University of Calgary. Introduction. There have been several studies of wide area network traffic (i.e., Internet traffic) We will look briefly at two of these: Caceres, Danzig, Jamin, and Mitzel - 1991 Paxson 1994.

WAN Measurements
E N D
Presentation Transcript
WAN Measurements Carey Williamson Department of Computer Science University of Calgary
Introduction • There have been several studies of wide area network traffic (i.e., Internet traffic) • We will look briefly at two of these: • Caceres, Danzig, Jamin, and Mitzel - 1991 • Paxson 1994
Measurement Method • The wide area network measurements collected by Caceres et al. focus solely on TCP/IP traffic • Uses tcpdump • Collected data from several different sites (e.g., UC Berkeley site: 5.9 million pkts/day)
Data Collection • Used Sun 3 workstation • Added special timer with 10 usec resolution • Collect 56 bytes of data from each packet, including data link, network, and transport layer information • Use well-known port ids to classify app’s • Packet loss: 0% (estimated)
Data Analysis • Characterizes different network applications based on a number of criteria • Number of bytes transferred • Duration of connections • Number of packets sent • Packet sizes • Packet interarrival times
Main Observations • Both interactive and bulk transfer traffic have a large number of short conversations • 75-90% of bulk transfer connections send less than 10 kilobytes • 90% of interactive conversations send less than 1000 packets, and 50% last less than 90 seconds in duration
Main Observations (Cont’d) • Most conversations are bidirection (even the bulk transfer ones) • Bulk transfer accounts for over 50% of the packets and bytes transferred • Interactive traffic: small packets • Bulk transfer: big packets • Bimodal packet size distribution results
Summary • One of the first detailed studies of wide area network TCP/IP traffic • Identified characteristics of the traffic for different network applications • Proposed models for packet size distribution, packet interarrival times, etc • Modeling package tcplib is available (free)
More WAN Measurements • ‘‘Measurements and Models of Wide Area TCP Conversations”, Vern Paxson, 1993 • More wide area network measurements • All TCP conversations between Lawrence Berkeley Laboratory (LBL) and the rest of the Internet world
Measurement Methodology • Uses tcpdump • Captures only SYN (start) and FIN (end) packets of TCP connections (conversations) • Provides all the information needed for conversation level characterization • Dramatically reduces storage space needed • Makes longer trace durations possible
Measurement Tools • Sun 3/50 on a network between LBL and the Internet • Capture all packet headers with SYN or FIN • Saved to local disk for later analysis • Headers have port id info for identifying specific network applications
Measurements • Results are reported for one month of data (first data set collected November 1990) • 123,703,757 packets seen • Average of 3.5 million per day (40 per sec) • 84 Mbyte of raw trace data • 210,868 conversations • Represents 5.6 Gbyte of user data
Measurements (Cont’d) • Elevent different application protocols identified in the traces • Results reported separately for each, as well as in aggregate • Repeated measurements at later times (e.g., March 1991) to assess growth in traffic with time
Data Analysis • Presents aggregate workload characteristics, as well as a per application breakdown • Volume of data transferred • Network bandwidth used • Conversation lifetime • Conversation interarrival times • Geographical distribution • Develops models for each application as well
Summary • A nice detailed study of wide area network TCP/IP traffic • Novel aspects: trace collection methodology, geographic analysis, models, growth • Identified significant growth in Internet traffic over fairly short time span • Growth continues to this day (and beyond!)